
Overview
Overview sits at the top of the sidebar, above Projects. It is the calm, at-a-glance answer to "what have my agents been doing?", across every project rather than one at a time.
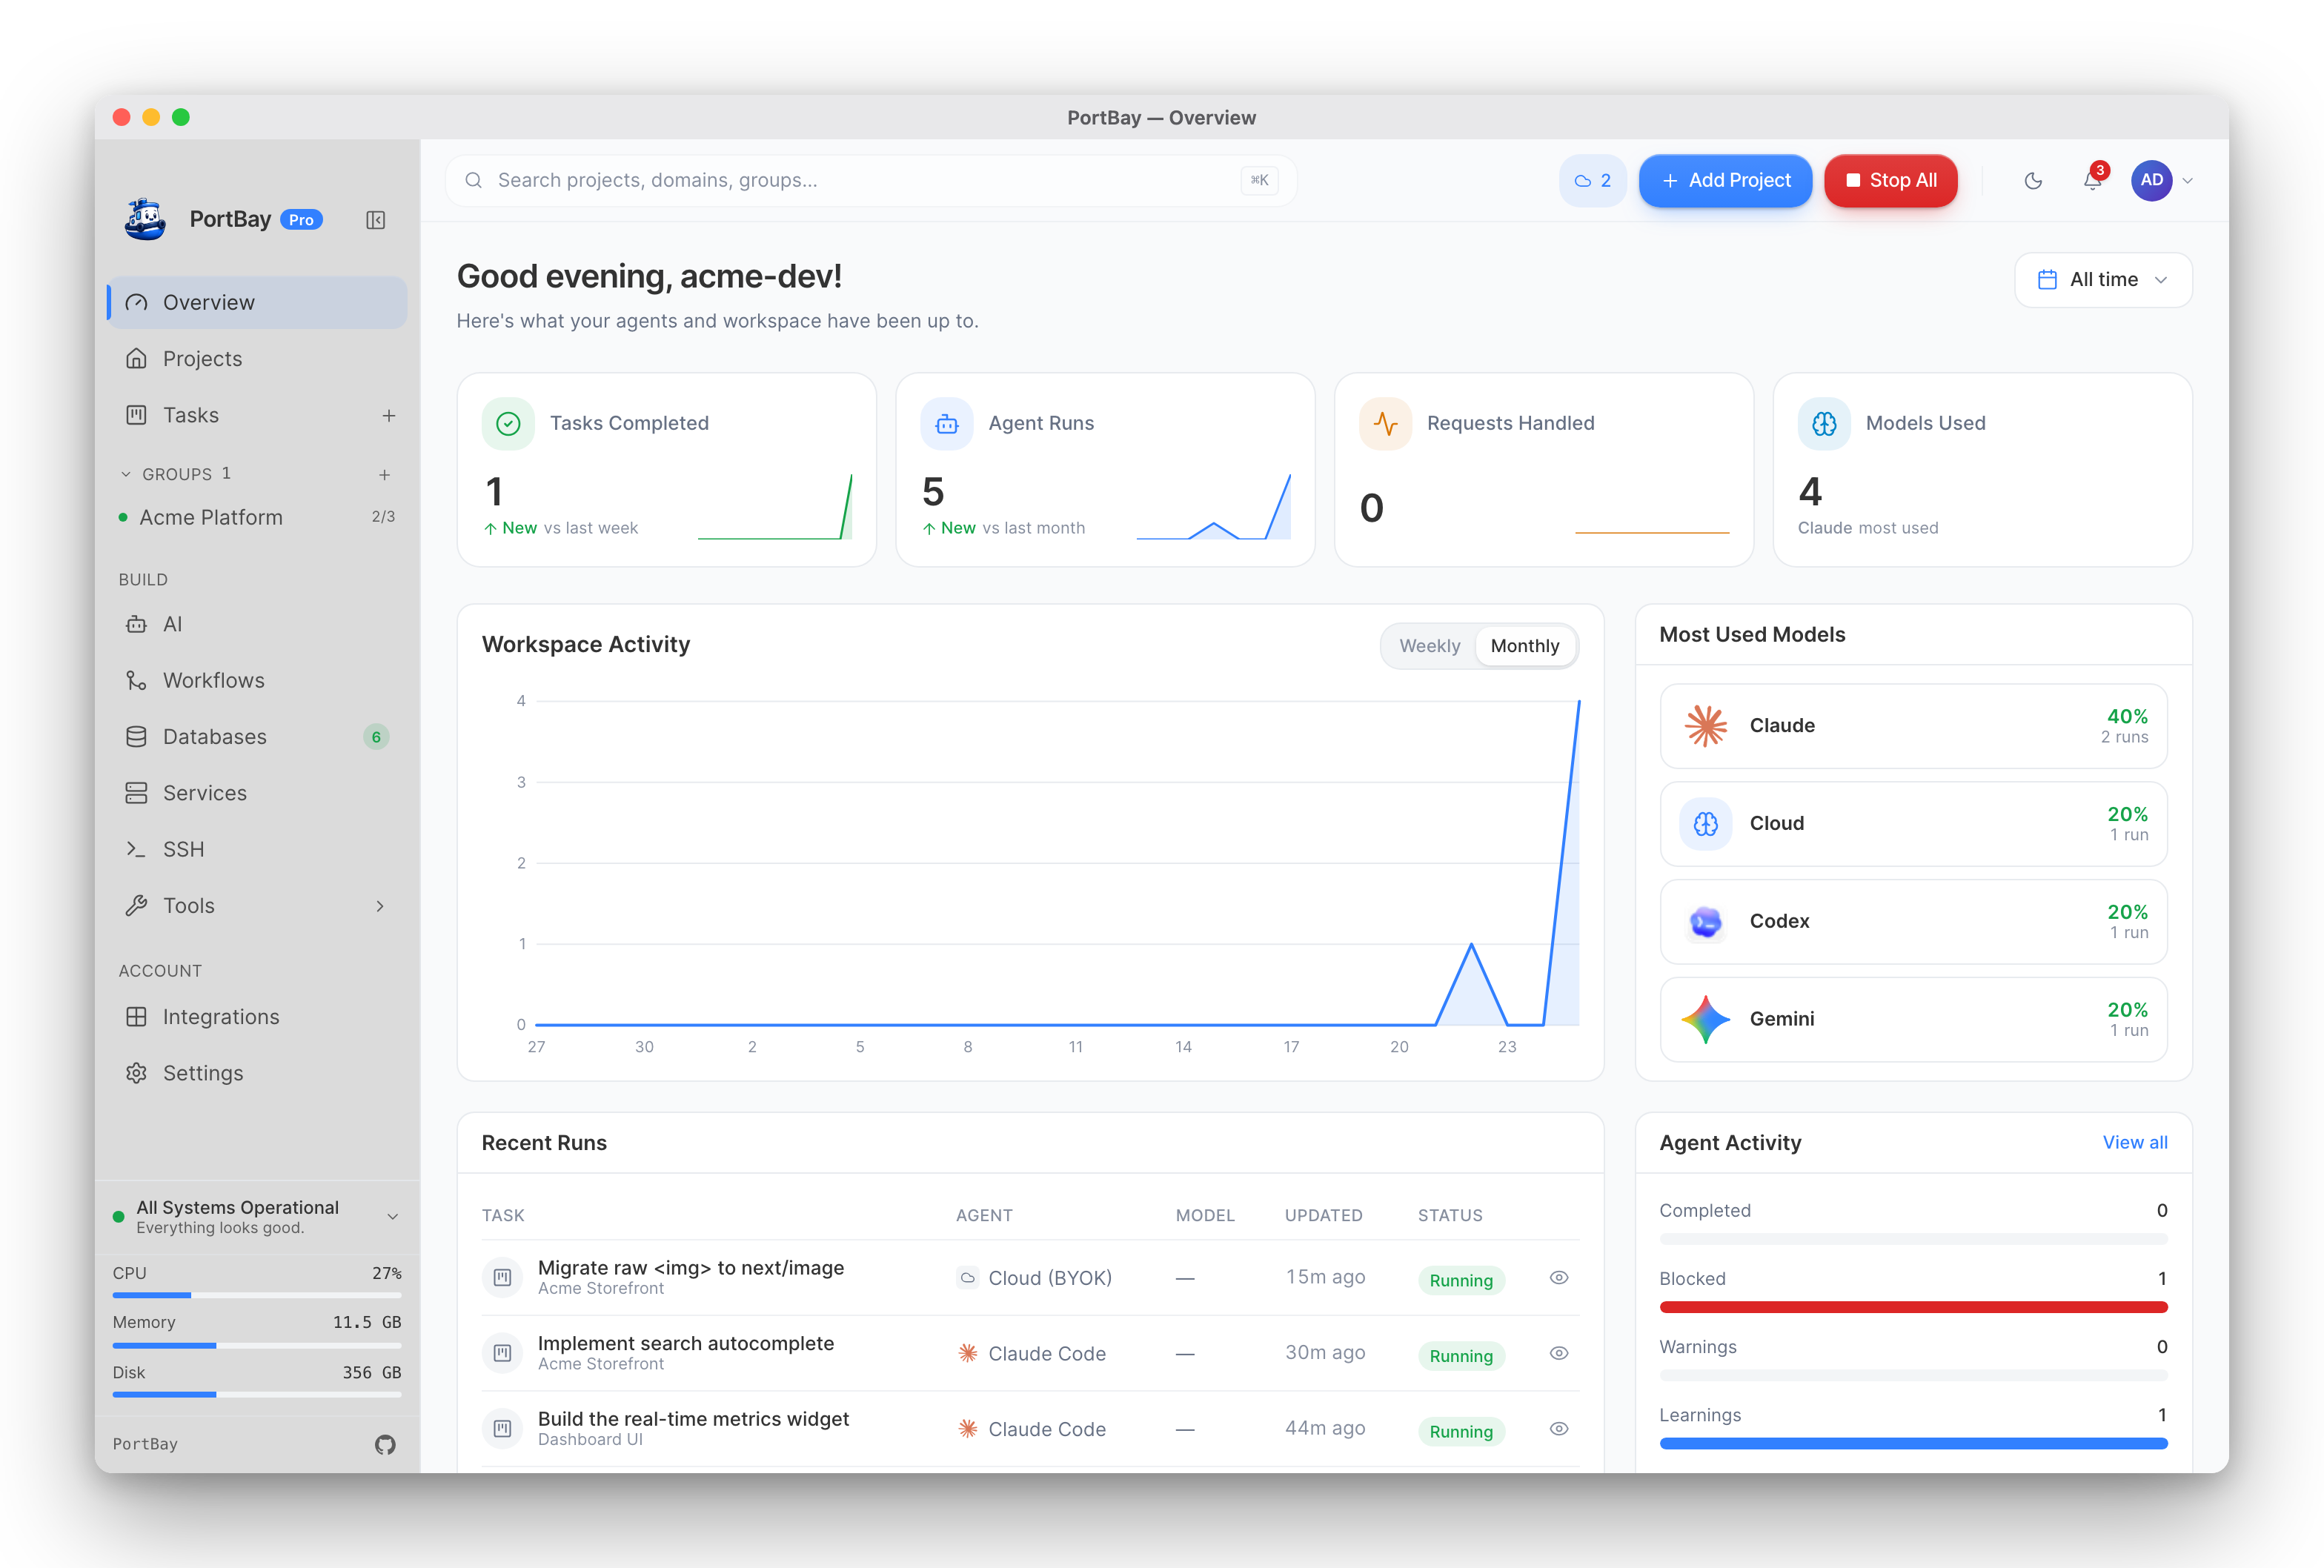
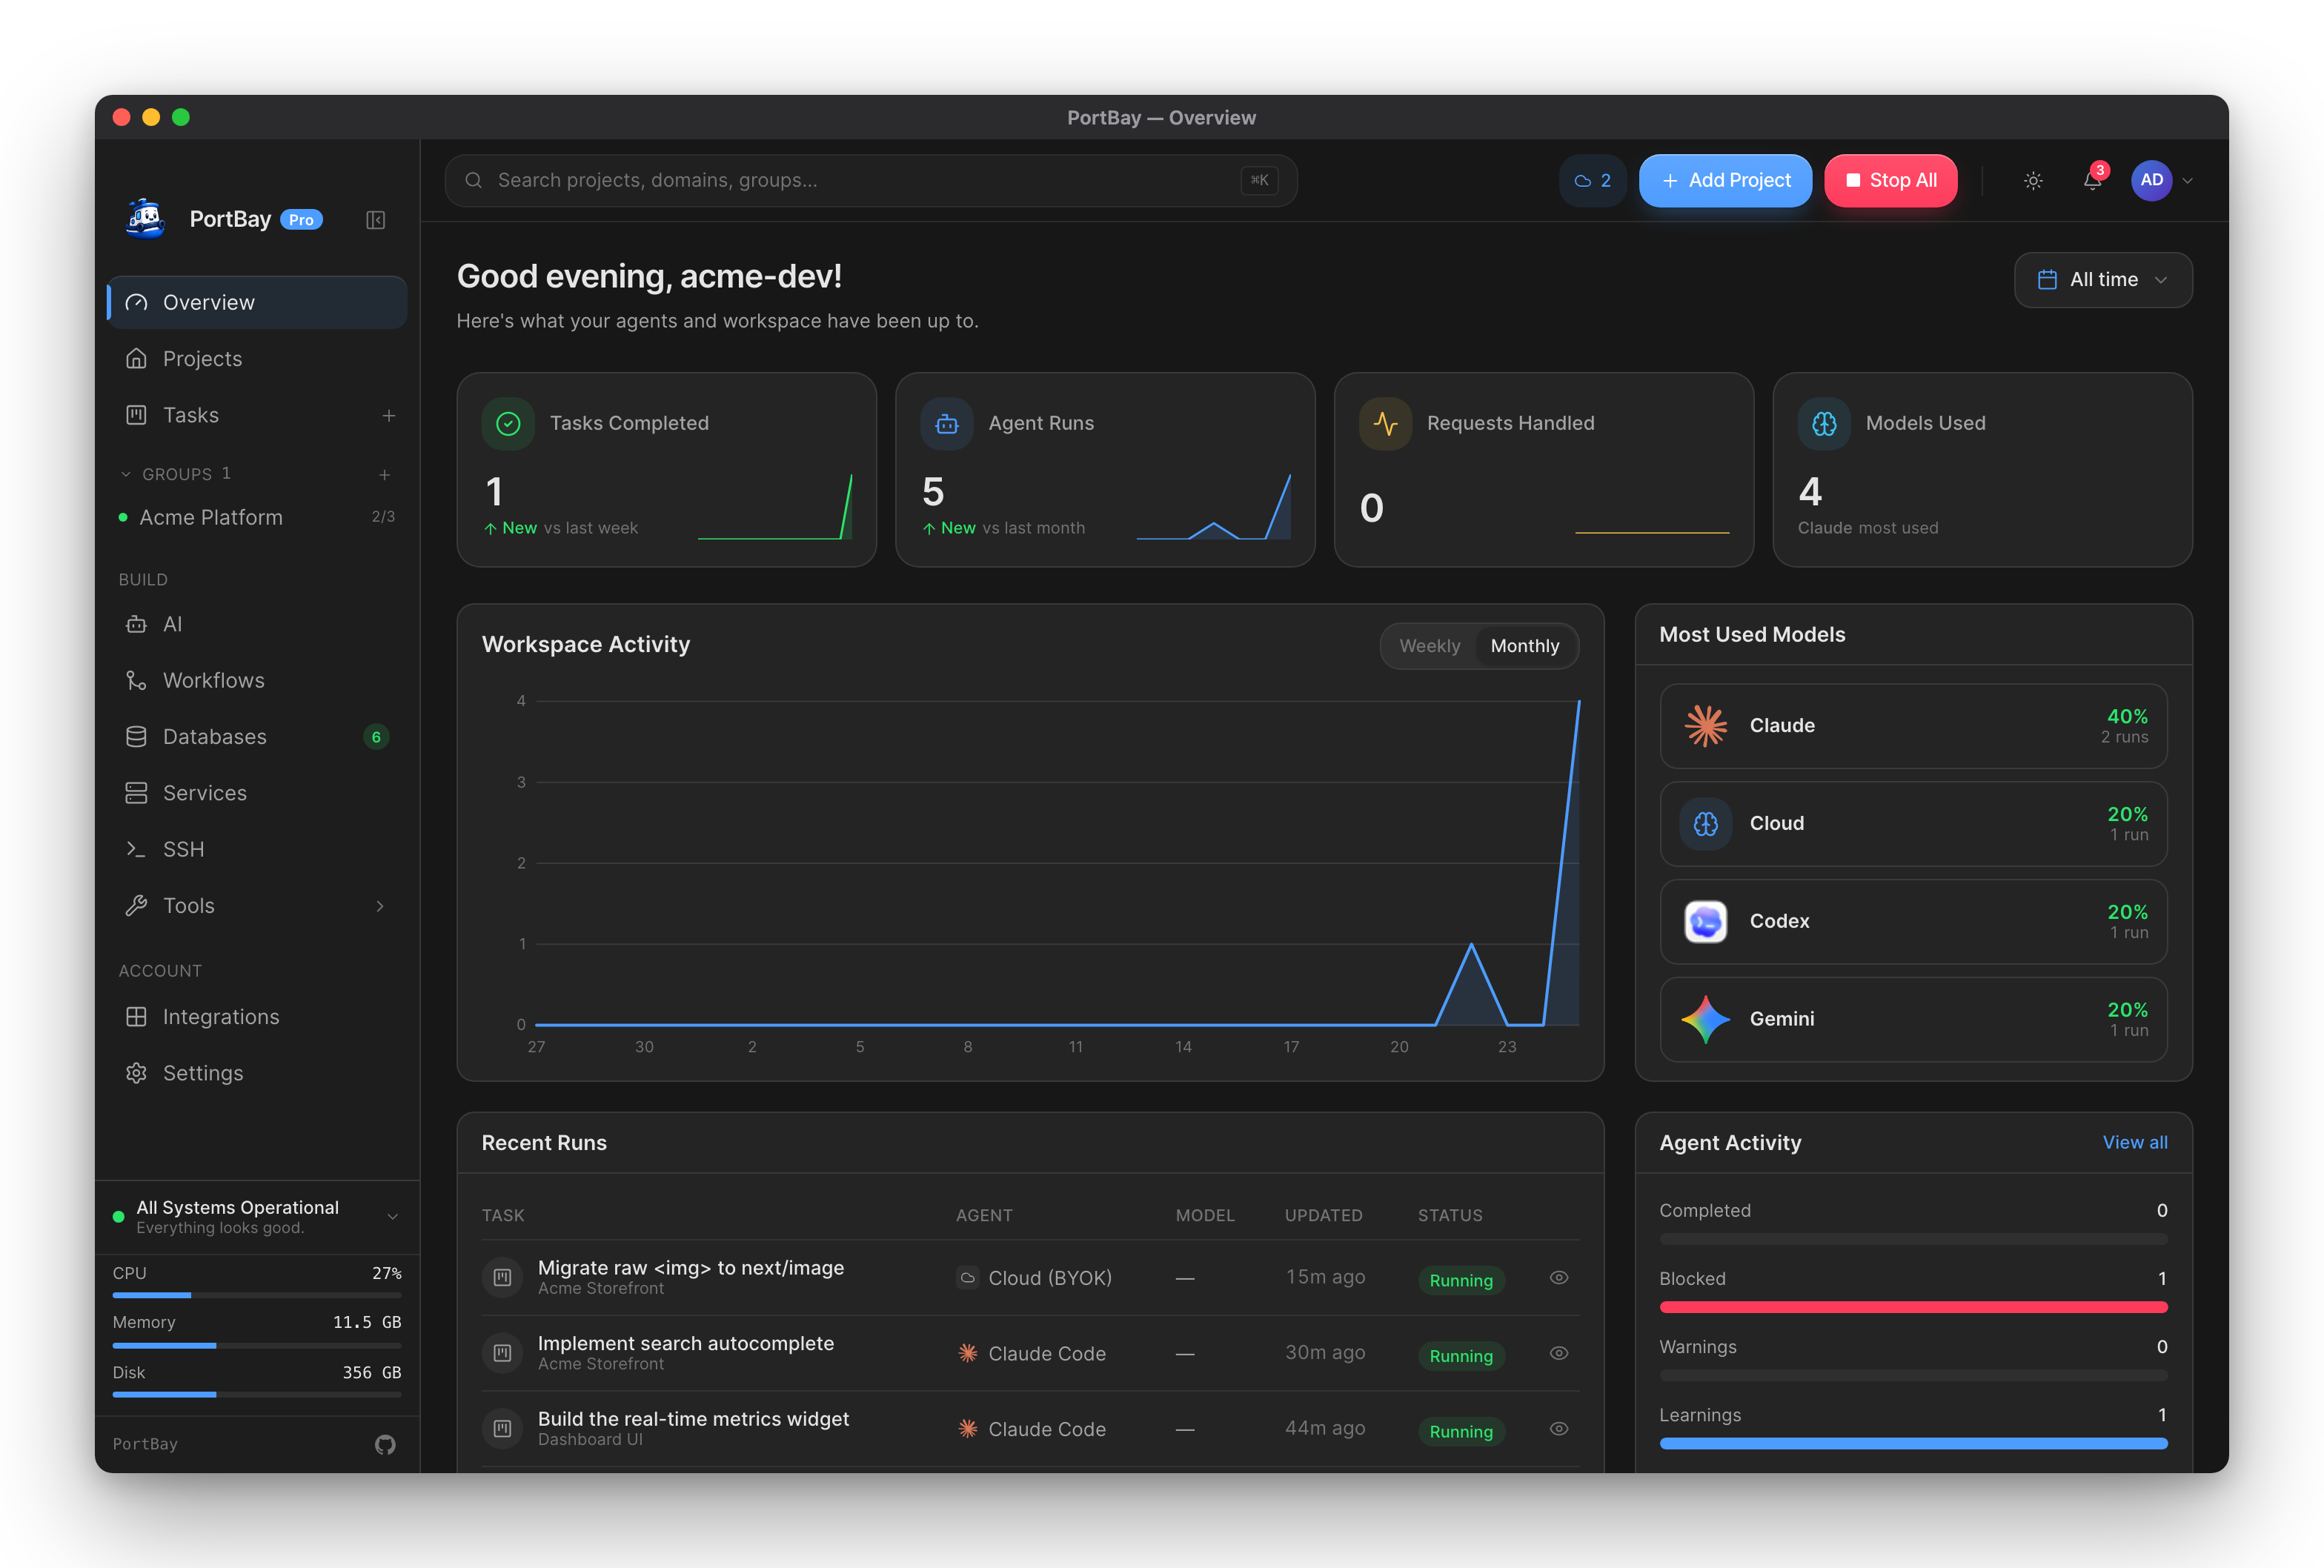
What it shows
KPI tiles across the top, each with a delta against the previous period:
- Tasks Completed — cards moved to Done, by anyone: you, an agent, or an MCP chat. A run that finishes is not counted until its card is moved to Done.
- Requests Handled — tool calls made by agents: those recorded in agent session transcripts, those reported by runs that left no transcript, calls to PortBay's MCP tools from other clients such as Claude Desktop, and the in-app voice companion's tool calls.
- Agent Runs — runs PortBay dispatched, agent sessions you started by hand, MCP chats that connected to PortBay (such as Claude Desktop), voice sessions, and runs known only from the board's record. An orchestrator's own run is not counted: it calls no model, and each agent it dispatches is already a run.
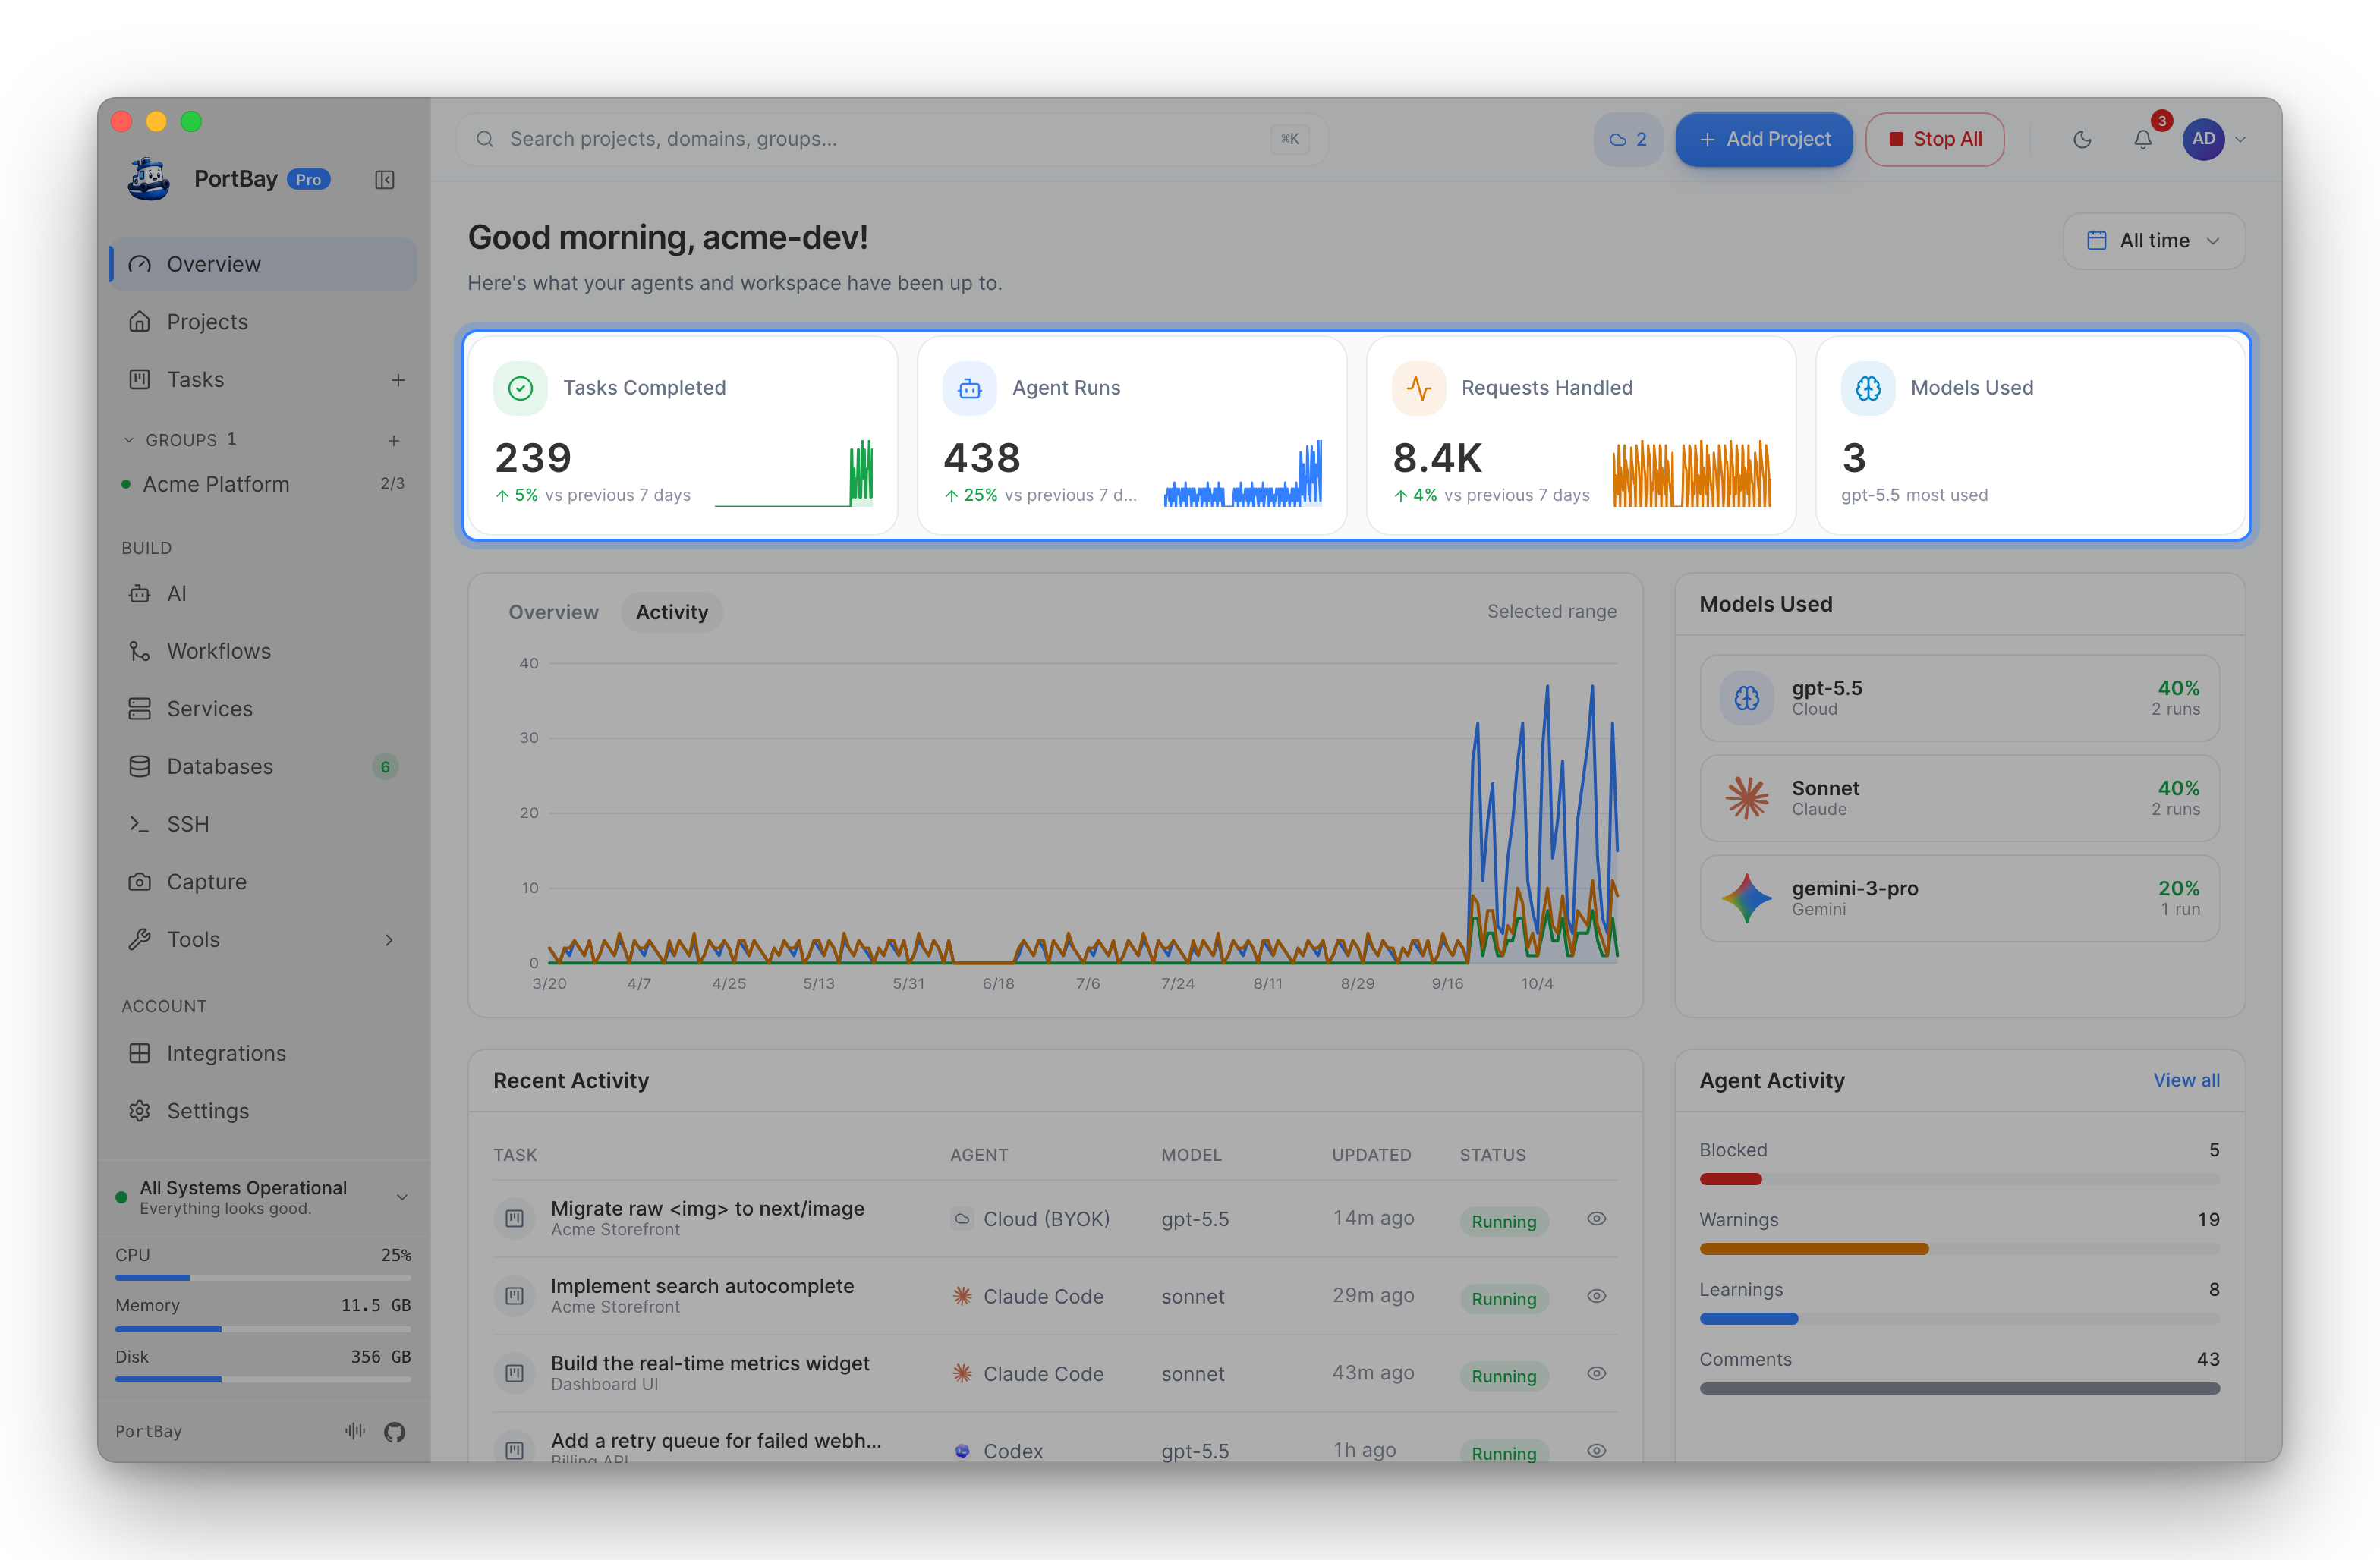
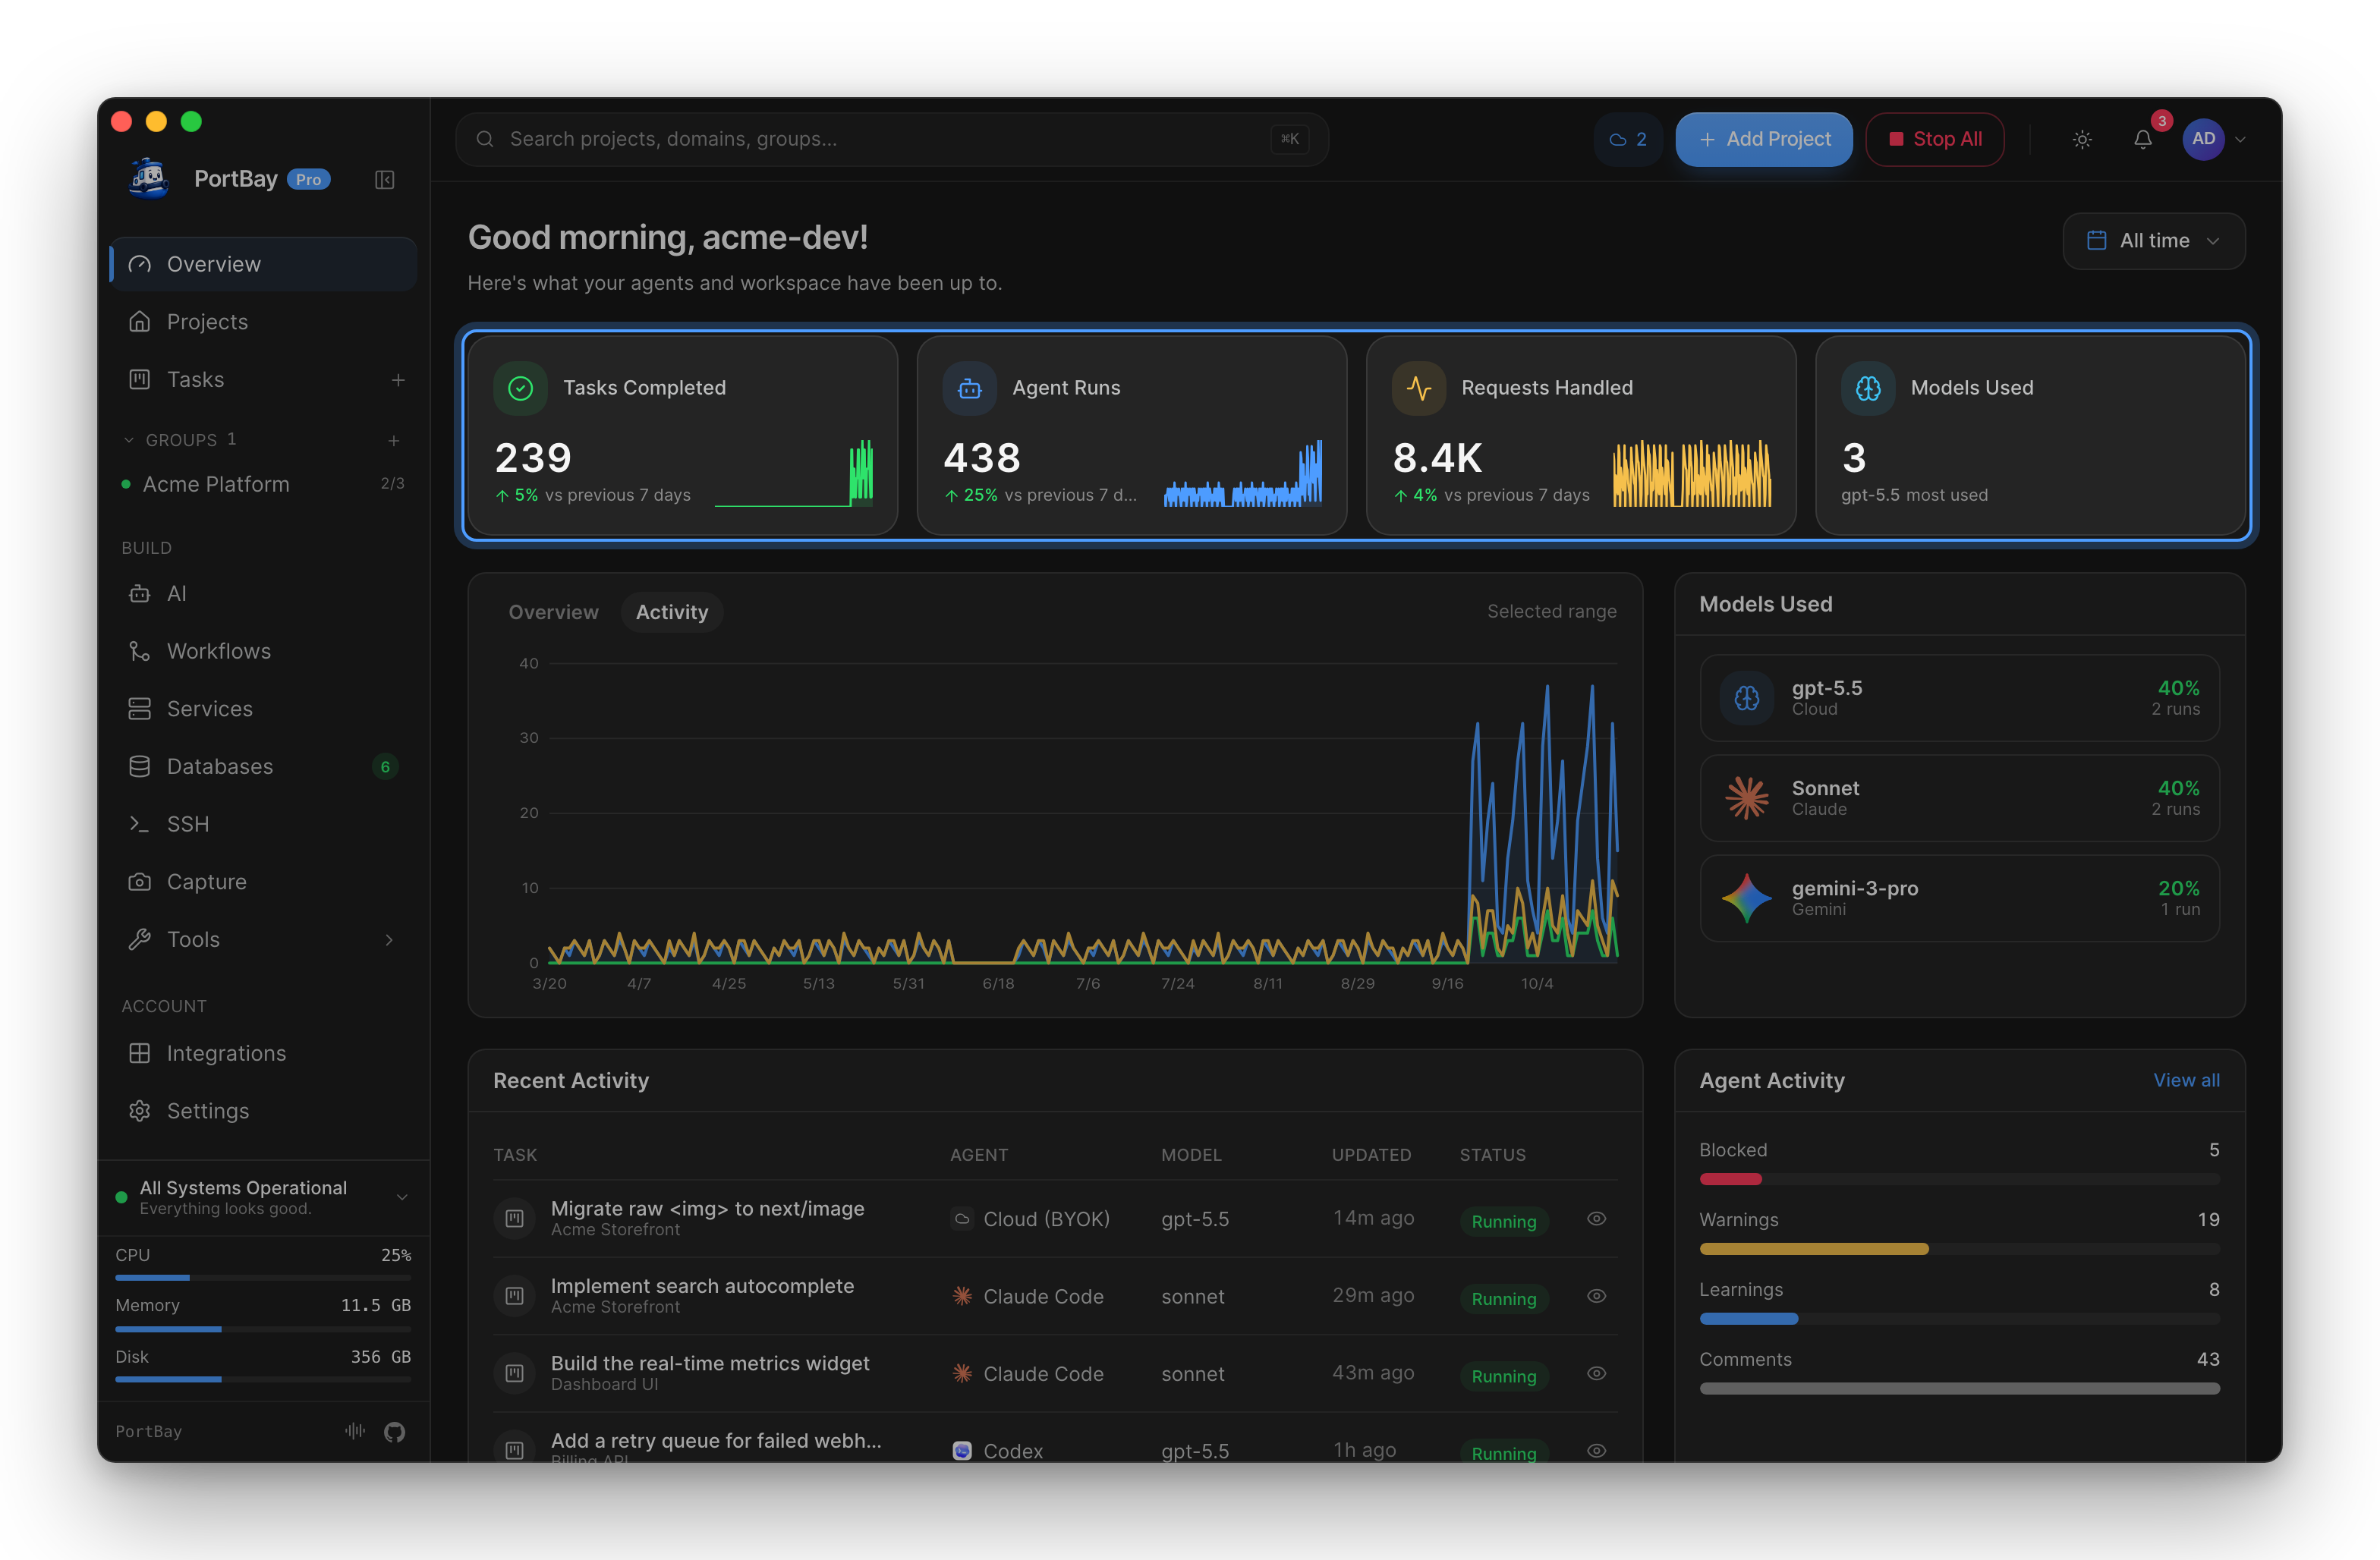
Activity chart — the trend over the selected range.
Models used by PortBay runs — a leaderboard of the models PortBay's dispatched runs recorded, ranked by run count, each with its share of those runs. Voice sessions carry no model, so they never appear here. Runs that recorded no model are listed after the models, one row per agent, marked "Model not recorded", with their run count but no share. The orchestrator is listed the same way, with PortBay's mark: it coordinates other agents and calls no model itself. The Models Used tile and its "most used" name count only recorded models, never these rows. When no run in the range recorded a model, the models currently loaded in Ollama are listed separately as loaded, not used.
Recent Activity — the newest runs across all projects, mixed with cards moved to Done or Blocked on the board, with the project, the agent, the model, and the outcome. Click through to the card.
Agent Activity — a breakdown of the activity feed by kind.
Use the range picker in the header to move between periods.
Loading and coverage
Each panel shows a placeholder until its data arrives. If a source is not ready when the page opens, PortBay retries it quietly twice, after about 1.5 and 4 seconds, before saying it could not be read. A refresh that fails after the page has loaded keeps the last numbers on screen and says how old they are.
All time adds up everything PortBay has kept, and a muted note under the chart names what that total cannot vouch for. Each line appears only when it applies:
- board counts up to a given date are approximate, because that history was archived without run ids;
- the chart draws board activity from a later date than the totals reach back to, because the chart keeps at most 400 days;
- voice or MCP-client history before a given date was not kept.
Where the numbers come from
Four lanes are unified on this page, which is why the totals are higher than any single surface would report:
| Lane | Feeds |
|---|---|
| Mission Control runs (cross-project, from the task board) | Agent Runs (runs started), the chart, Recent Activity, the model leaderboard |
| Board audit trail — every actor: your own drags, the CLI, MCP sessions, agent run summaries | Every move to Done into Tasks Completed; runs known only from the board, and MCP chat sessions, into Agent Runs; board changes into the chart; Done and Blocked moves into Recent Activity; the Agent Activity breakdown |
| Agent sessions and MCP connections — Claude Code and Codex session transcripts on this Mac, plus other MCP clients that call PortBay's tools | Sessions you started by hand and MCP chats into Agent Runs; their tool calls into Requests Handled; the tiles and contribution grid on the Workspace Activity card's Overview tab |
| Voice agent — the voice companion's tool calls, totalled per day | Requests Handled (tool calls), and voice sessions folded into Agent Runs |
Agent sessions are counted only when they are related to PortBay: dispatched by PortBay, run inside one of your registered projects or their worktrees, or calling a PortBay MCP tool. Sessions in unrelated folders are left out, and the Overview tab says how many.
A session PortBay dispatched is counted once, as a run, not again as a hand-started session. A tool call is counted once: calls from a transcribed run come from its transcript, and only runs with no transcript contribute their own reported calls.
MCP calls from Claude Code and Codex are counted from their session transcripts. If a transcript has been deleted, the calls it recorded are not counted.
Every tile has an empty state: a lane that has never been used says so rather than showing a zero that looks like a failure.