
HTTP Request Inspector
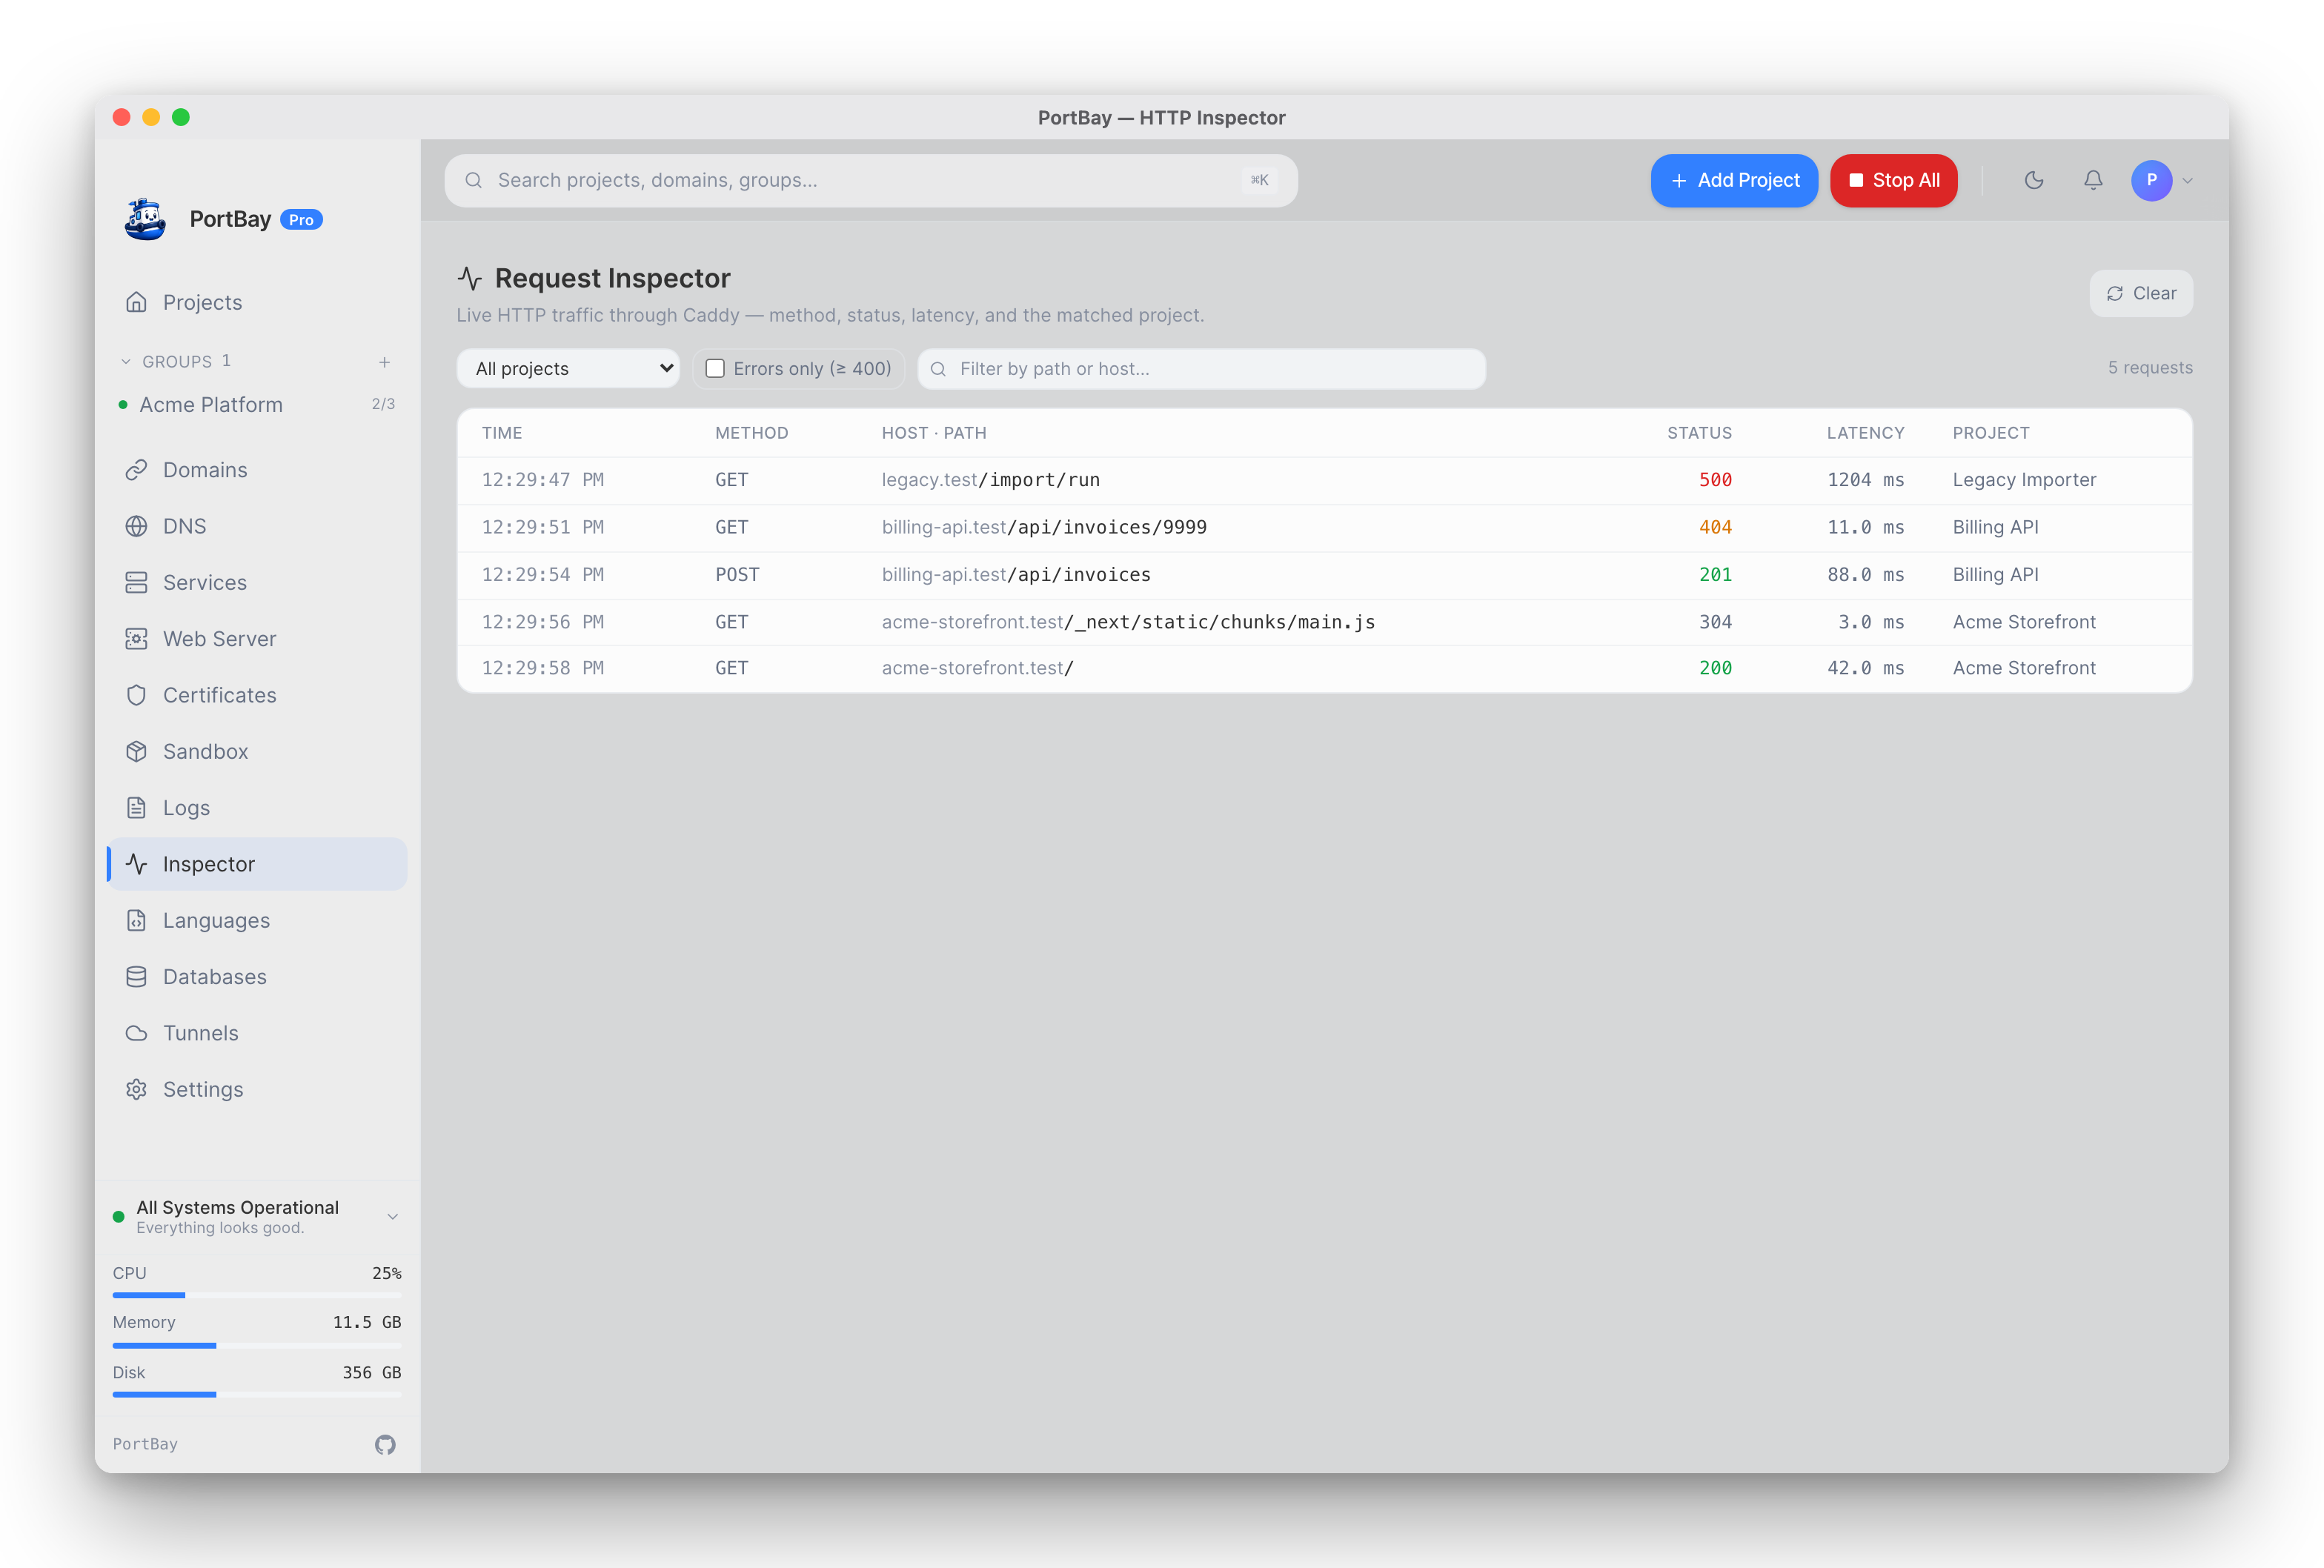
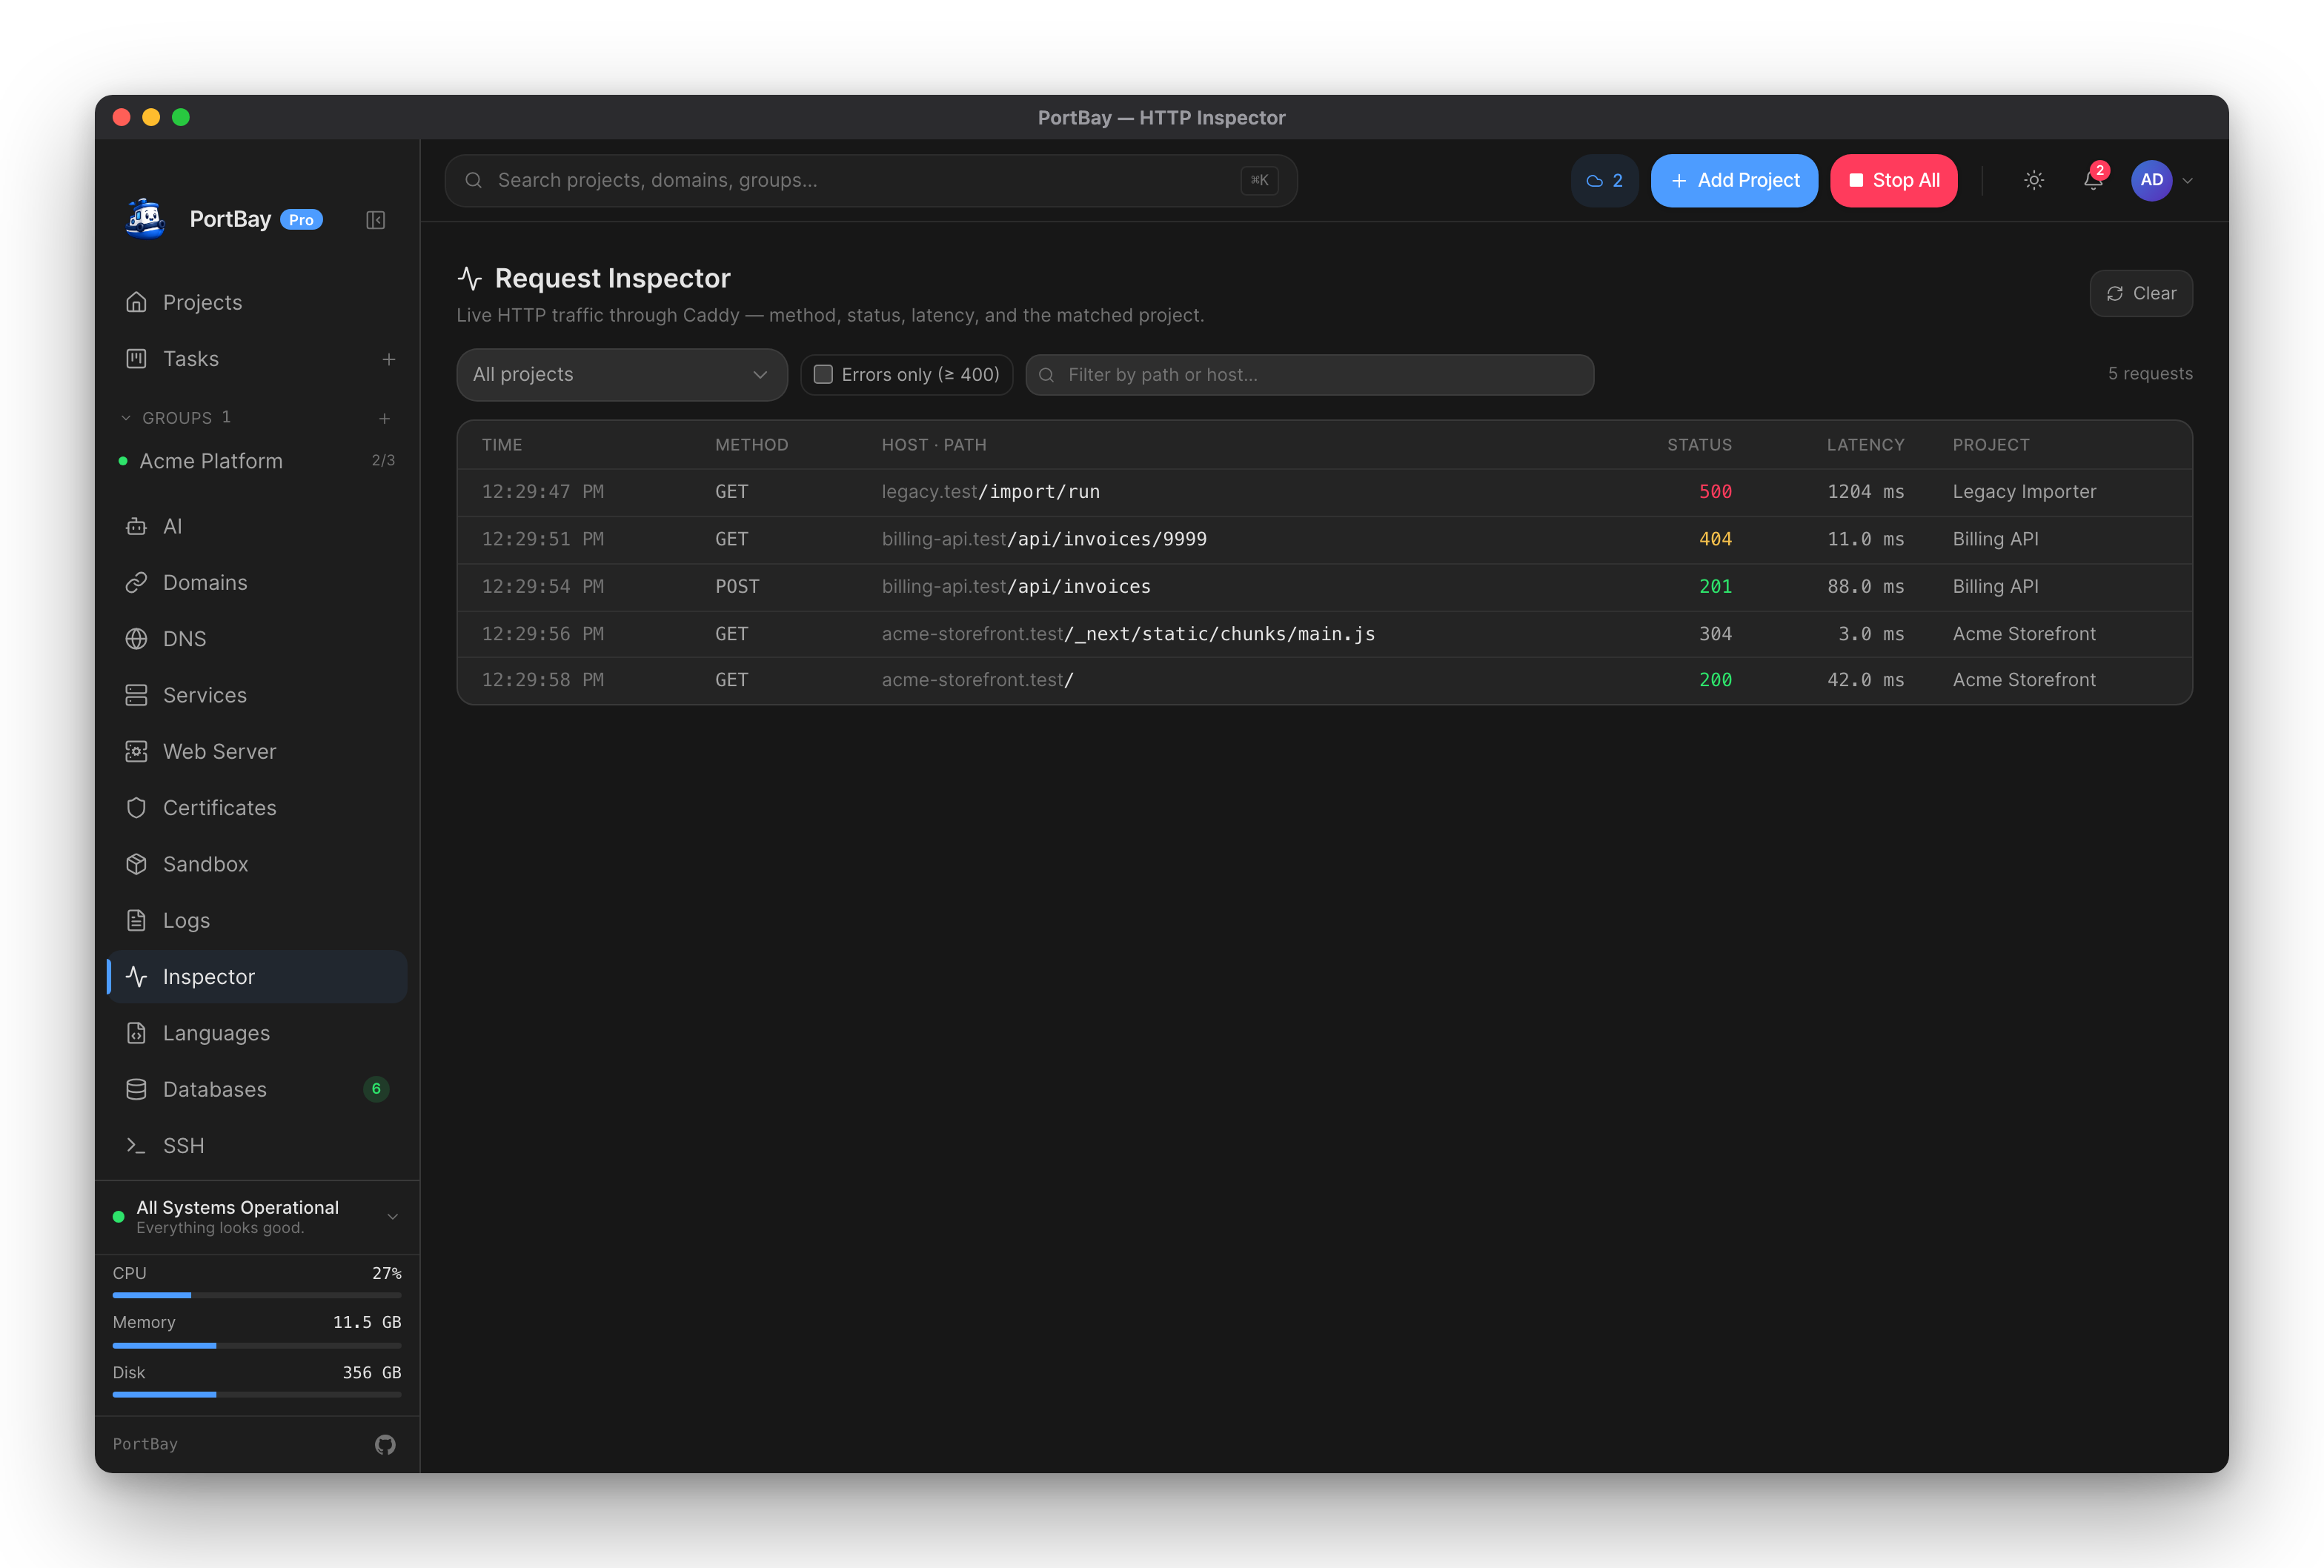
The HTTP Request Inspector is a live, DevTools-Network-style view of the traffic flowing through Caddy. It works by tailing Caddy's structured JSON access log in a background thread, parsing each line into a RequestEntry, mapping the request host to the matching PortBay project, and emitting a portbay://request event to the /inspector UI. The table shows method, host, path, status code, latency, response size, and matched project — but not request or response bodies; Caddy's access log does not include body content.
Quickstart
- Open the Inspector view from the sidebar (
/inspector). - Open one of your running projects in the browser (e.g.
https://myapp.test). - Rows appear in real time as Caddy serves each request. On first open, the last 200 log lines backfill the table automatically.
No configuration is needed. The inspector is always active as long as Caddy is running.
How-to
Filter requests
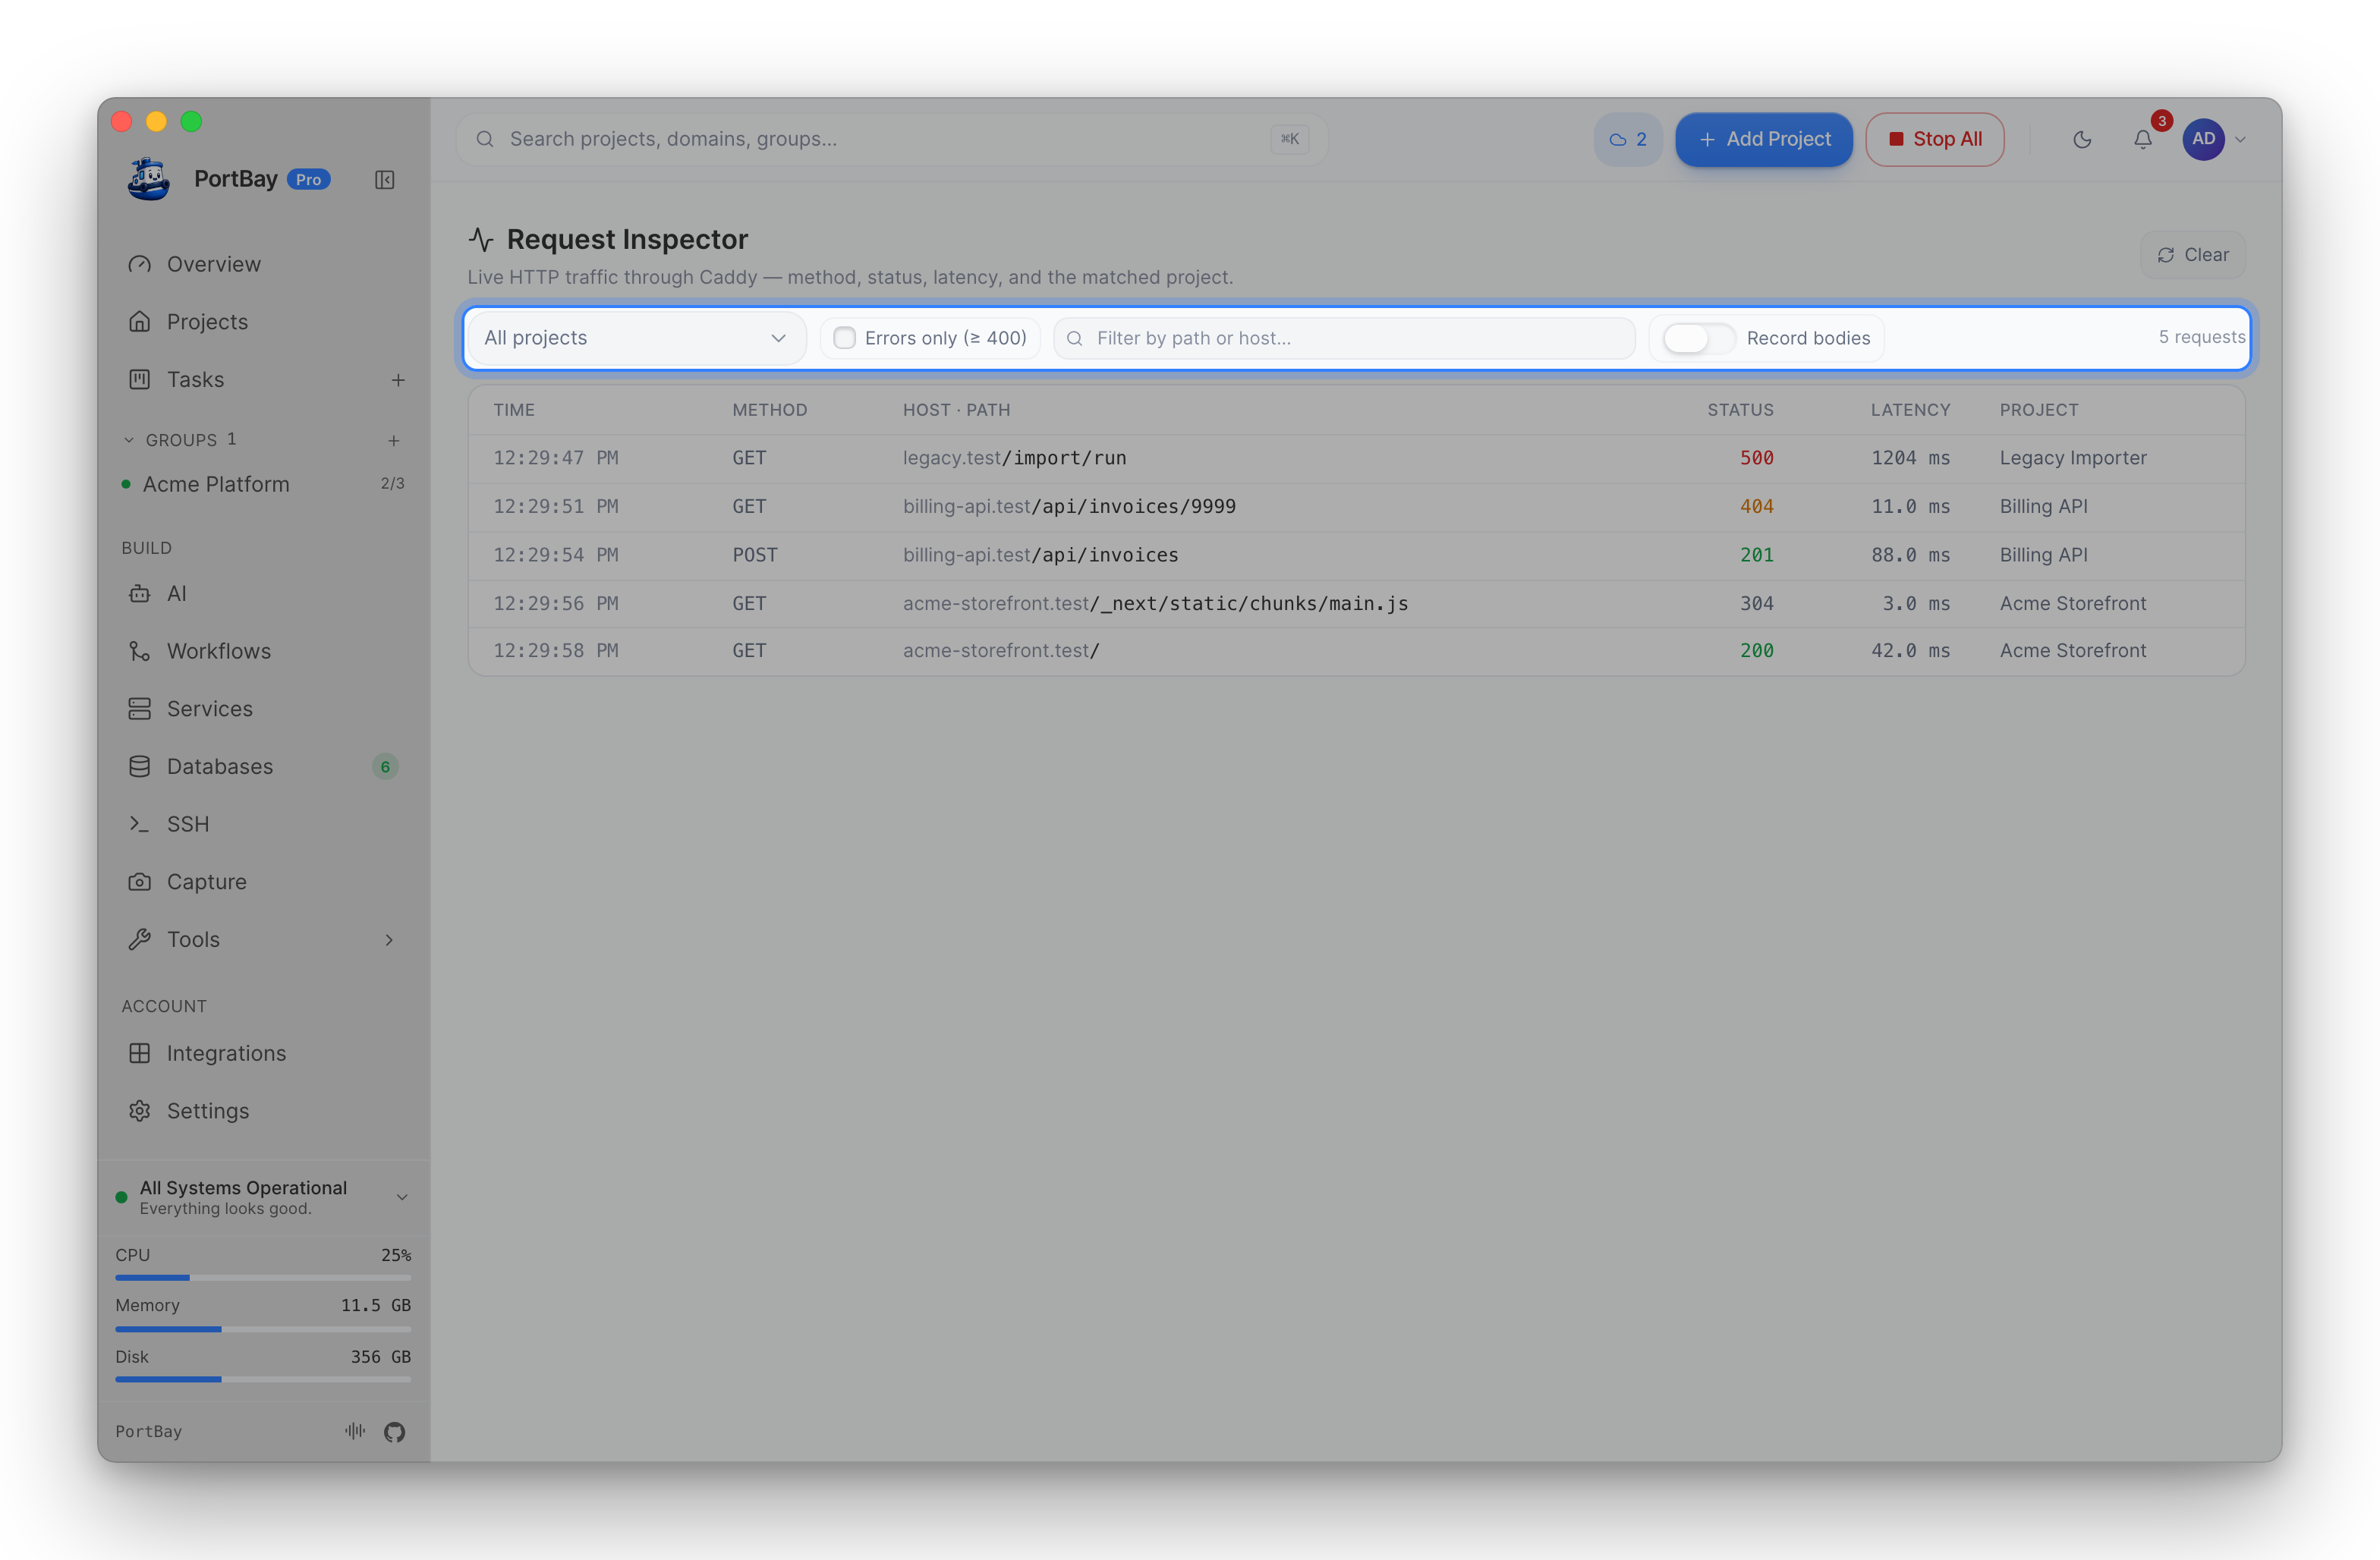
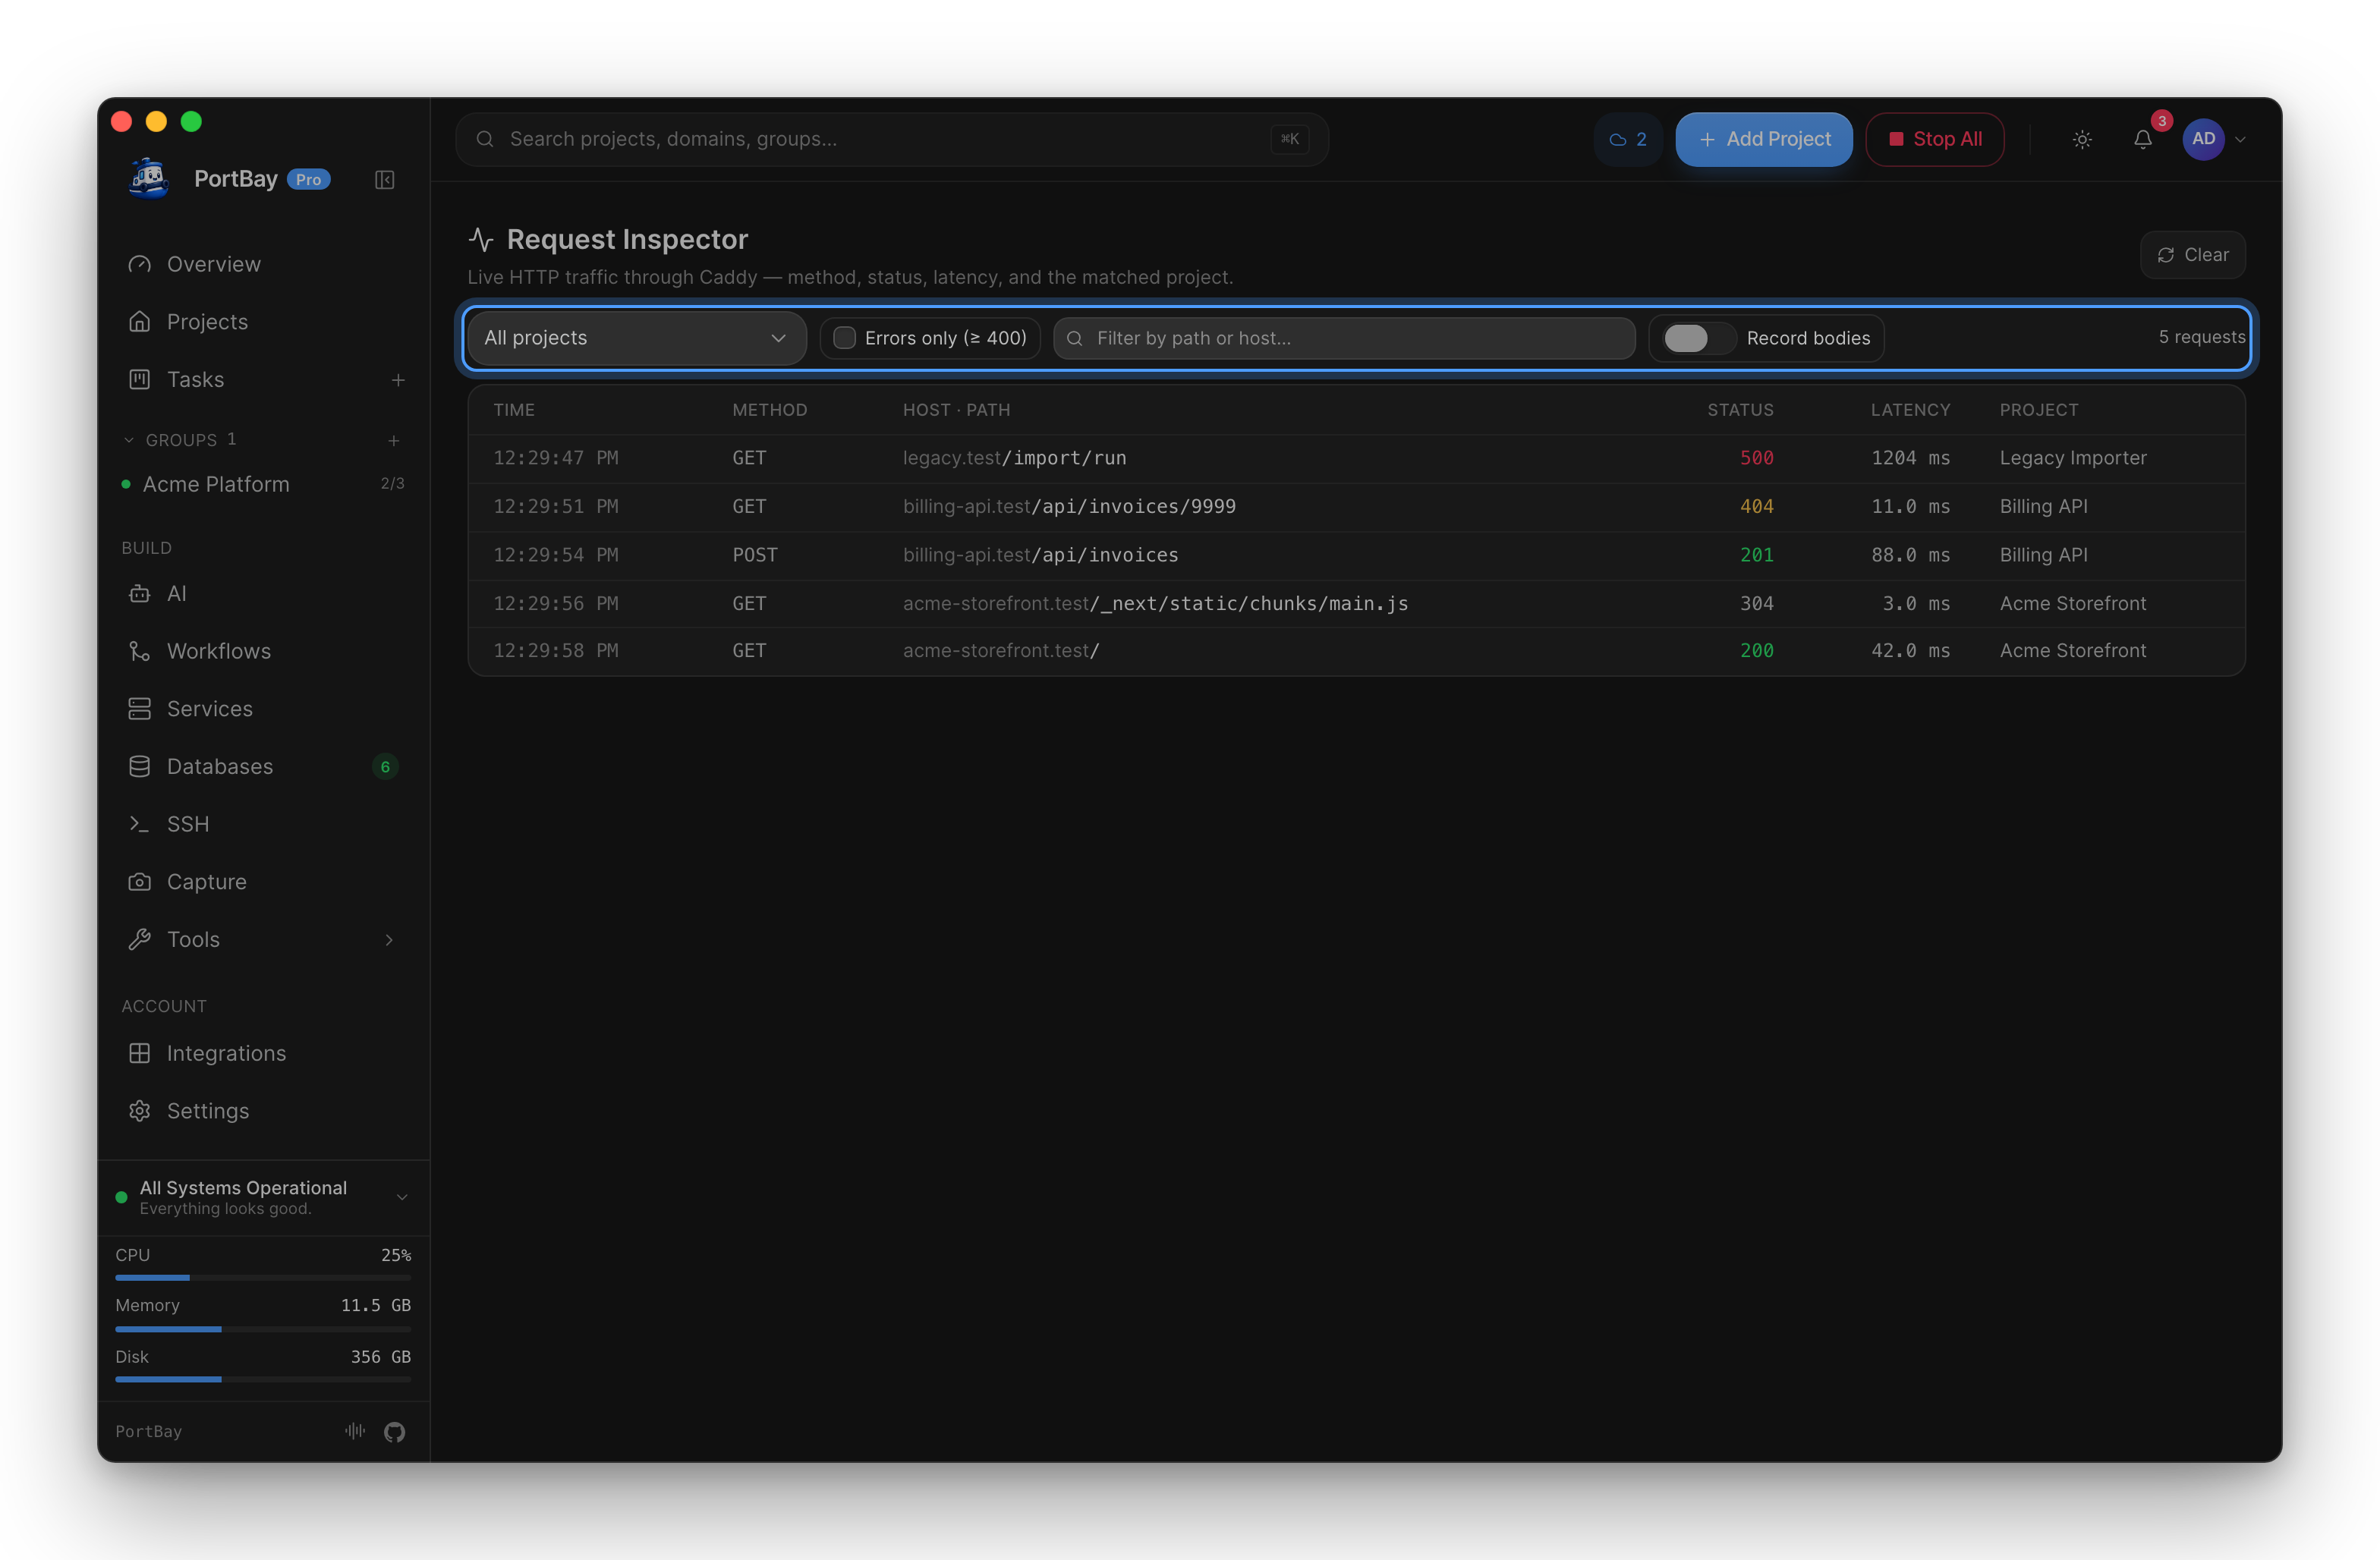
Three filters are available in the toolbar and apply locally — no round-trip to the backend.
| Filter | How it works |
|---|---|
| Project selector | Shows only requests whose host maps to the selected project. Hosts that do not match any known project are excluded when a project is selected. |
| Errors only (≥ 400) | Hides all responses with a status code below 400. Useful when debugging a failing endpoint. |
| Path / host search | Substring match against both the URI path and the host. Case-insensitive. |
The counter at the right of the filter bar shows <visible> / <total> when a filter hides some rows. The table renders at most 500 rows at a time regardless of how many entries the in-memory buffer holds (the buffer itself is capped at 1 000 entries).
Inspect a row
Click any row to expand it. The detail pane shows:
- The full host and timestamp in ISO 8601 format.
- Response size in bytes.
- All request headers Caddy logged, displayed as
header-name: value1, value2.
Click the same row again to collapse. Only one row is expanded at a time.
Clear the log
Click Clear in the top-right corner. This truncates the on-disk access log (caddy-access.log) and empties the in-memory buffer. The live stream continues from the next incoming request.
Log rotation
The background tailer detects rotation: if the access log shrinks (Caddy truncated or rolled it), the reader resets to the start of the new file. No manual action is needed. The host → project mapping is refreshed from the registry every five seconds during idle polling.
Reference
RequestEntry fields
The wire format is camelCase JSON, matching the TypeScript interface in src/lib/types/inspector.ts.
| Field | Type | Description |
|---|---|---|
ts | number | Unix milliseconds when Caddy handled the request. |
method | string | HTTP method (GET, POST, etc.). |
host | string | The Host header value as logged by Caddy. |
uri | string | Request URI including query string. |
status | number | HTTP response status code. |
durationMs | number | Round-trip duration in milliseconds (Caddy's duration field × 1 000). |
size | number | Response body size in bytes. |
projectId | string | undefined | The PortBay project whose hostname matches host. Absent when no project is matched. |
reqHeaders | Record<string, string[]> | undefined | Request headers Caddy logged. Each key maps to an array of values. Absent when Caddy logged no headers for the entry. |
IPC commands
| Command | Arguments | Returns | Notes |
|---|---|---|---|
recent_requests | limit?: number (default 200, max 2 000) | RequestEntry[] (oldest → newest) | Reads the last 512 KB of the access log on disk. Returns an empty array if no log exists yet. |
clear_requests | — | — | Truncates caddy-access.log to zero bytes. No-op when the file does not exist. |
Event model
The backend emits one event per parsed log line on the channel portbay://request. The payload is a single RequestEntry object. Non-access log lines (Caddy informational messages, partial reads, malformed JSON) are silently dropped; only lines that contain a request object and a status field produce events.
The frontend subscribes via @tauri-apps/api/event's listen() on mount and unsubscribes on unmount. The in-memory buffer rolls when it reaches 1 000 entries, dropping the oldest.
Log file location
~/Library/Application Support/PortBay/logs/caddy-access.logCaddy creates this file on its first served request. The file path is determined by AppState.logs_dir at runtime.
Troubleshooting
| Symptom | Likely cause | Next action |
|---|---|---|
| Table is empty after opening a project URL | Caddy is not running or the access log has not been created yet | Open Services and verify Caddy is active. Hit a project URL once to trigger log creation. |
Requests appear but Project column shows — | The request host does not match any registered project hostname | Confirm the project is registered and its hostname resolves correctly. |
| Request headers section shows "No request headers logged" | Caddy omitted headers for that entry | This is normal for some Caddy log configurations; the remaining fields are still accurate. |
| Inspector stops updating after a long session | The tailer thread encountered an unrecoverable error | Restart PortBay. The tailer restarts on app launch. |