
Log Viewer
The log viewer shows output from a single project's process. It supports static snapshots and live streaming.
Opening Logs
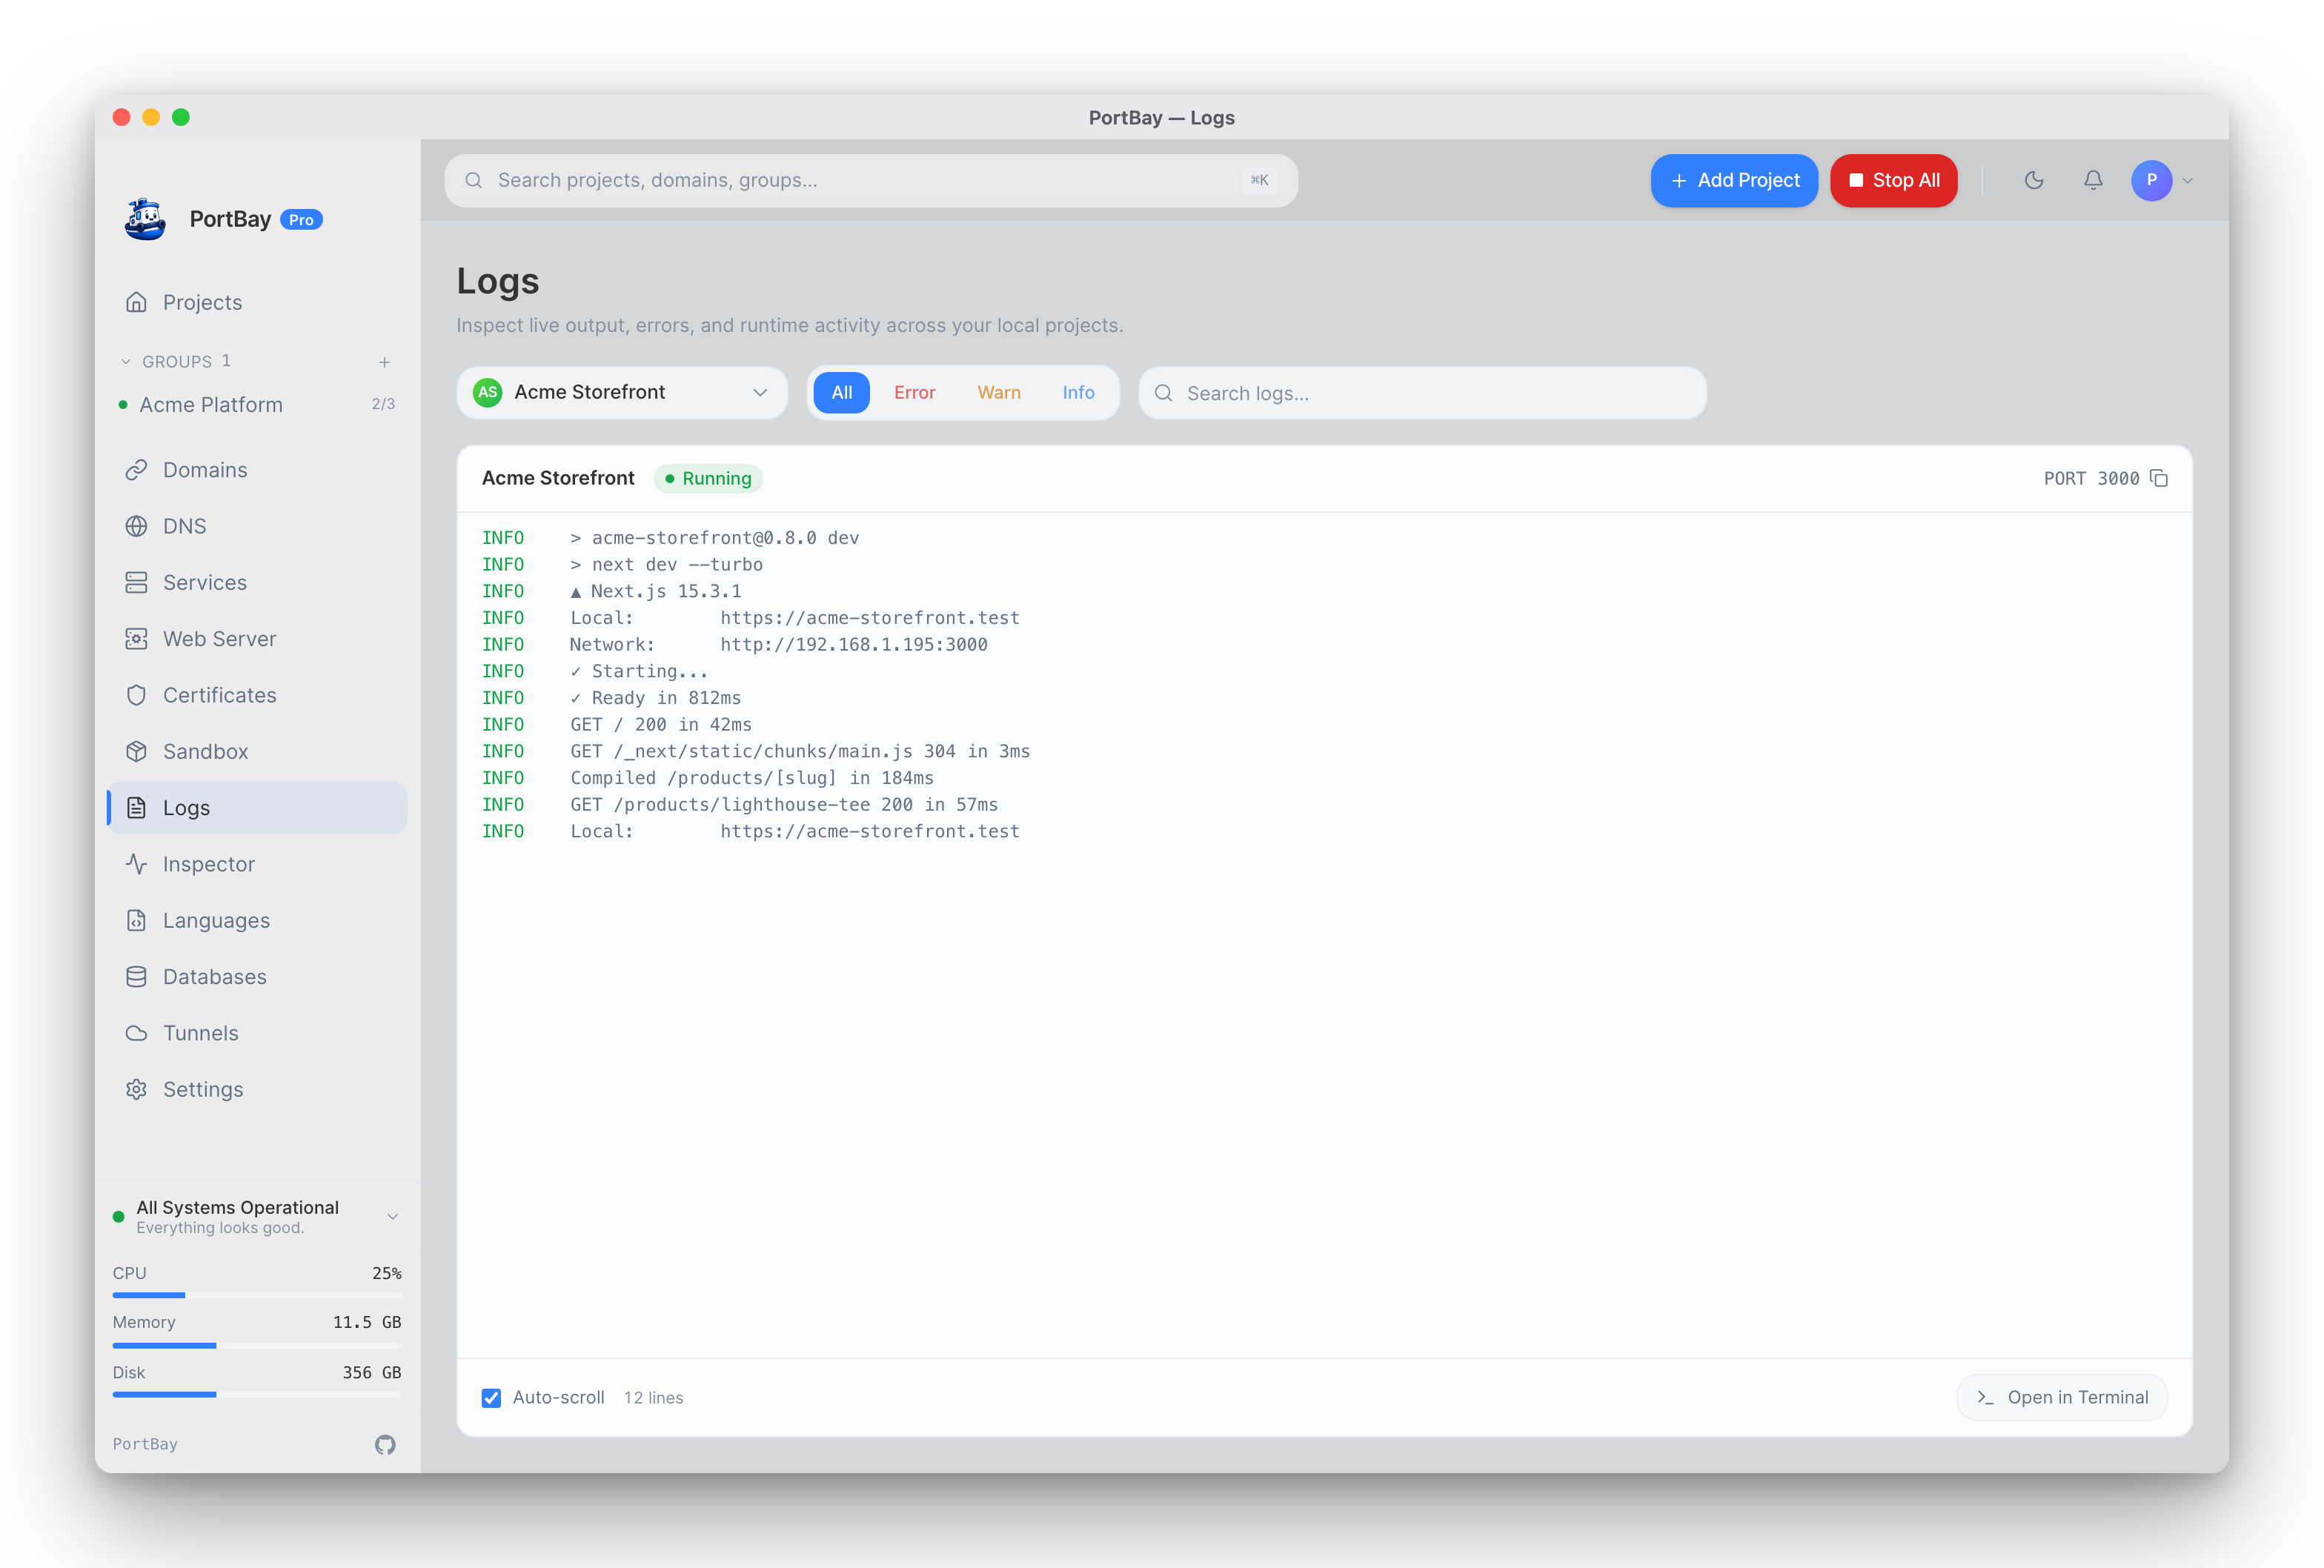
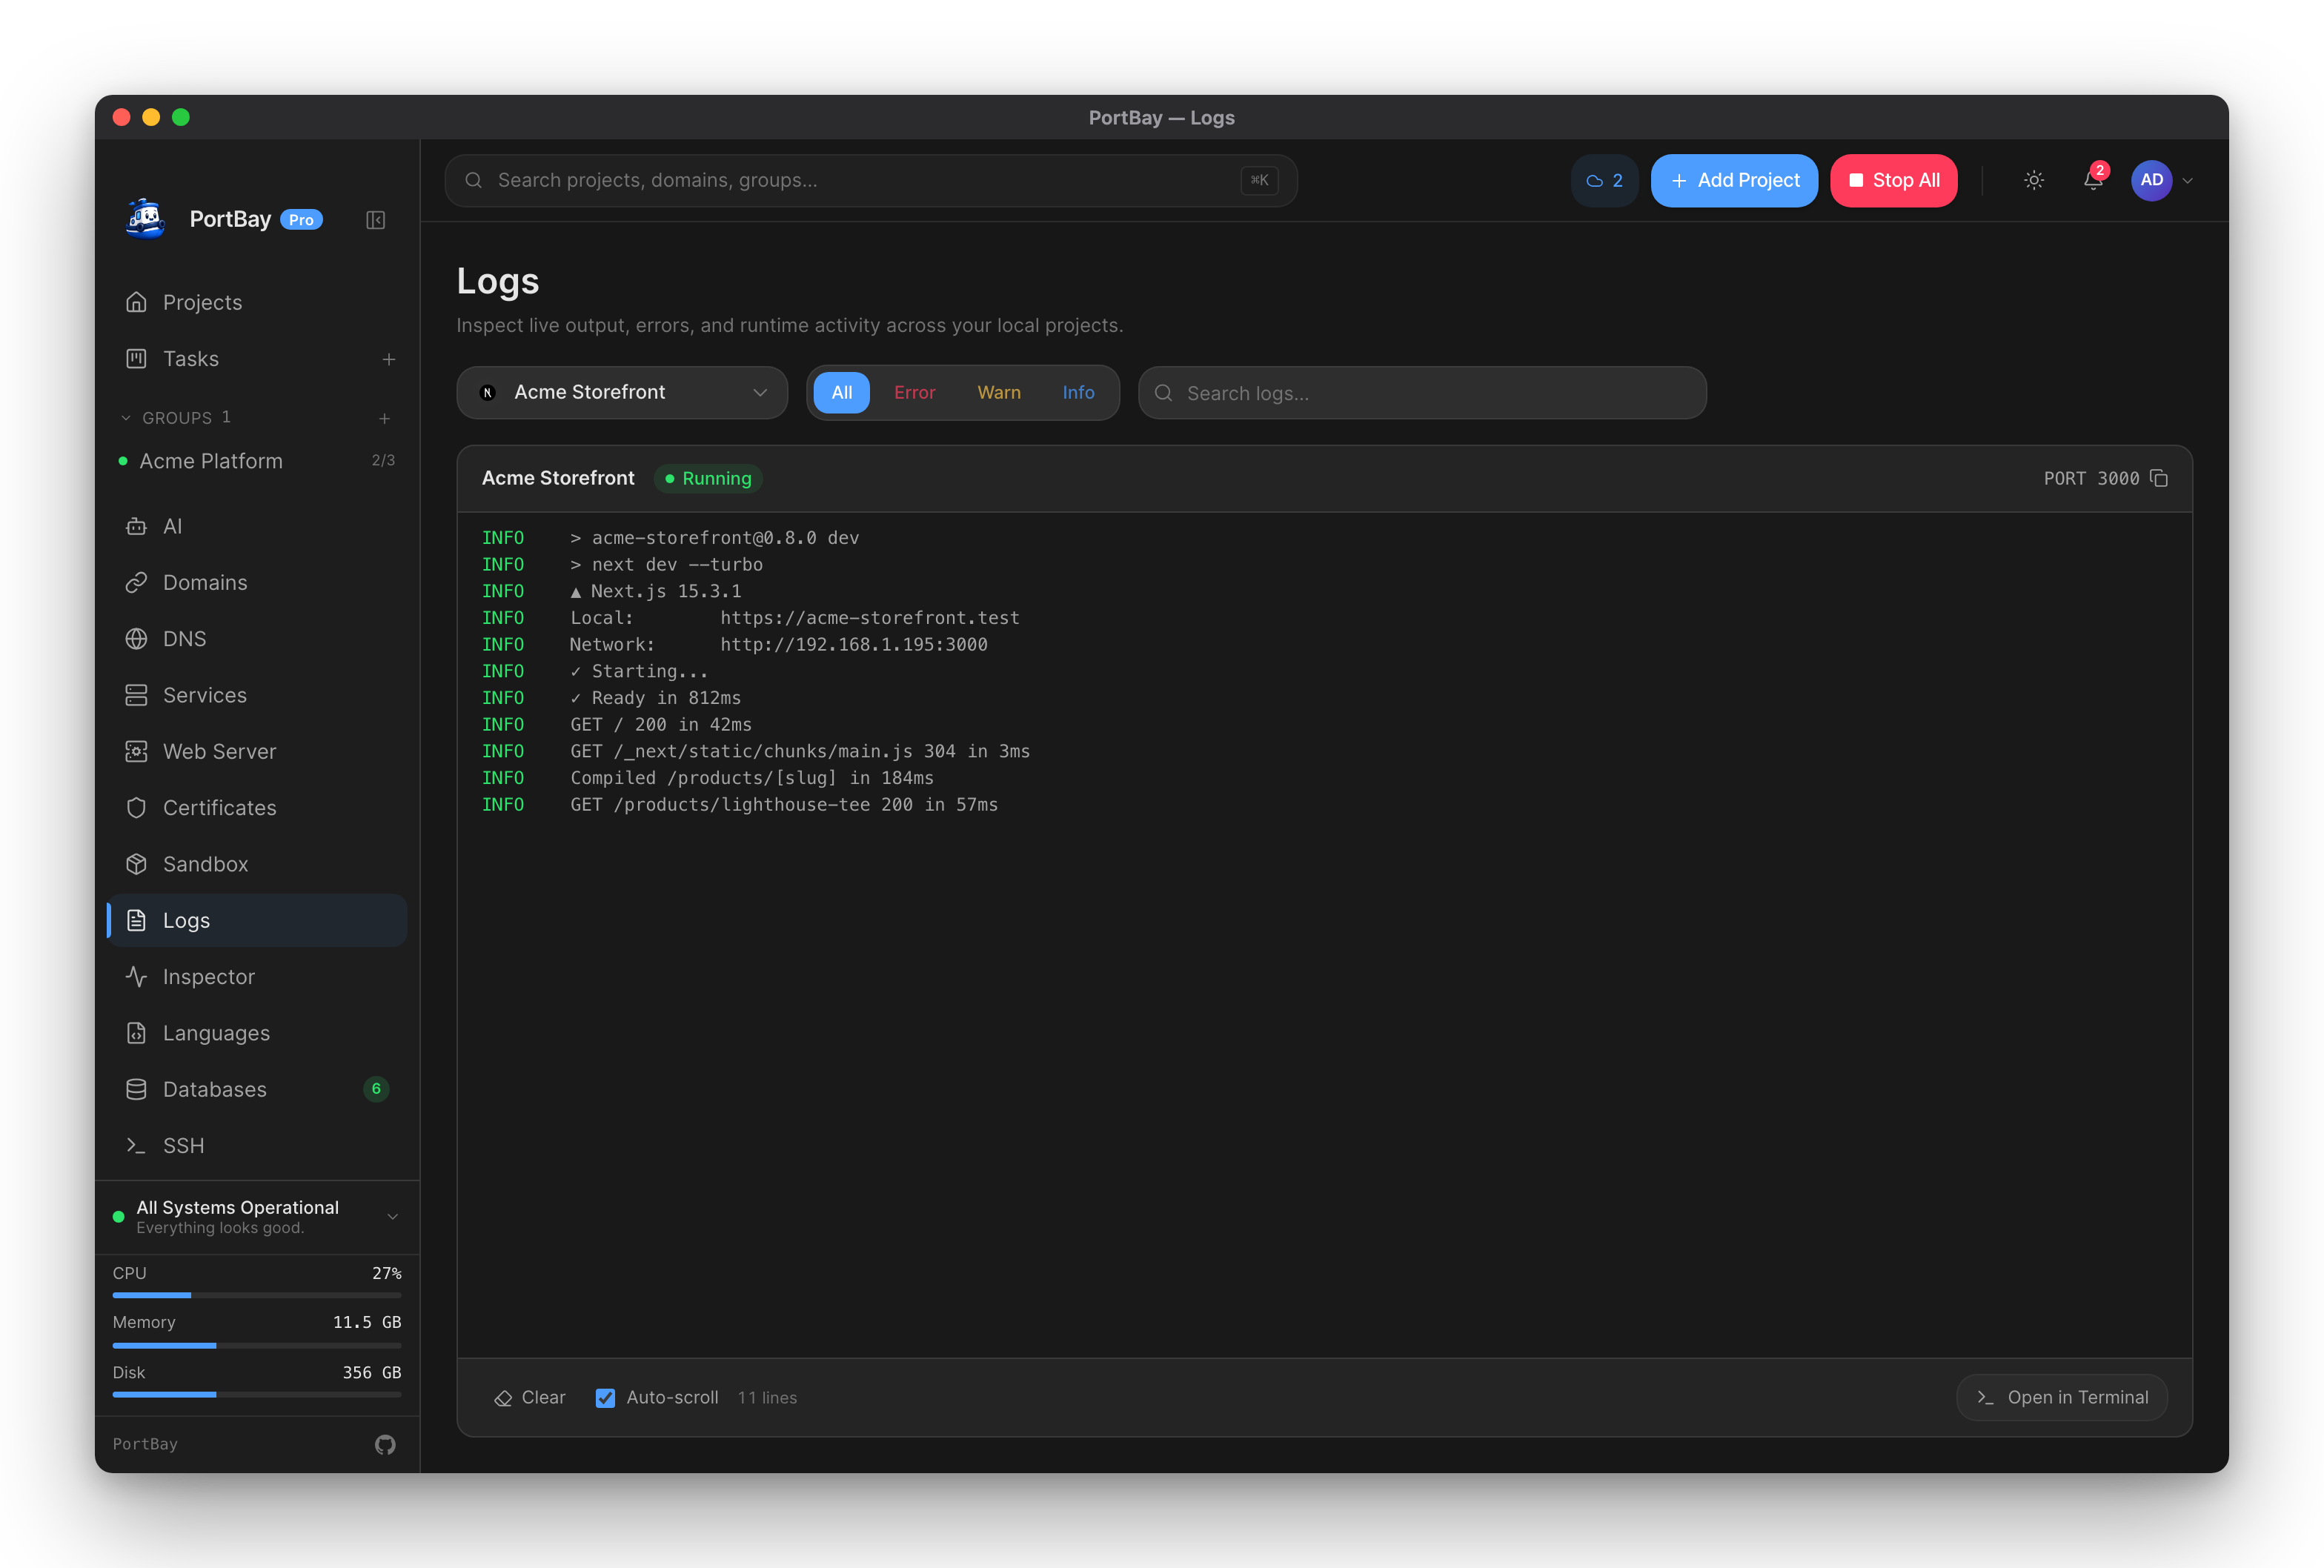
Click the log icon on any project row, or open a project's detail panel and click "Logs". The viewer loads recent output, then follows new lines live, and resets whenever you open it for a different project.
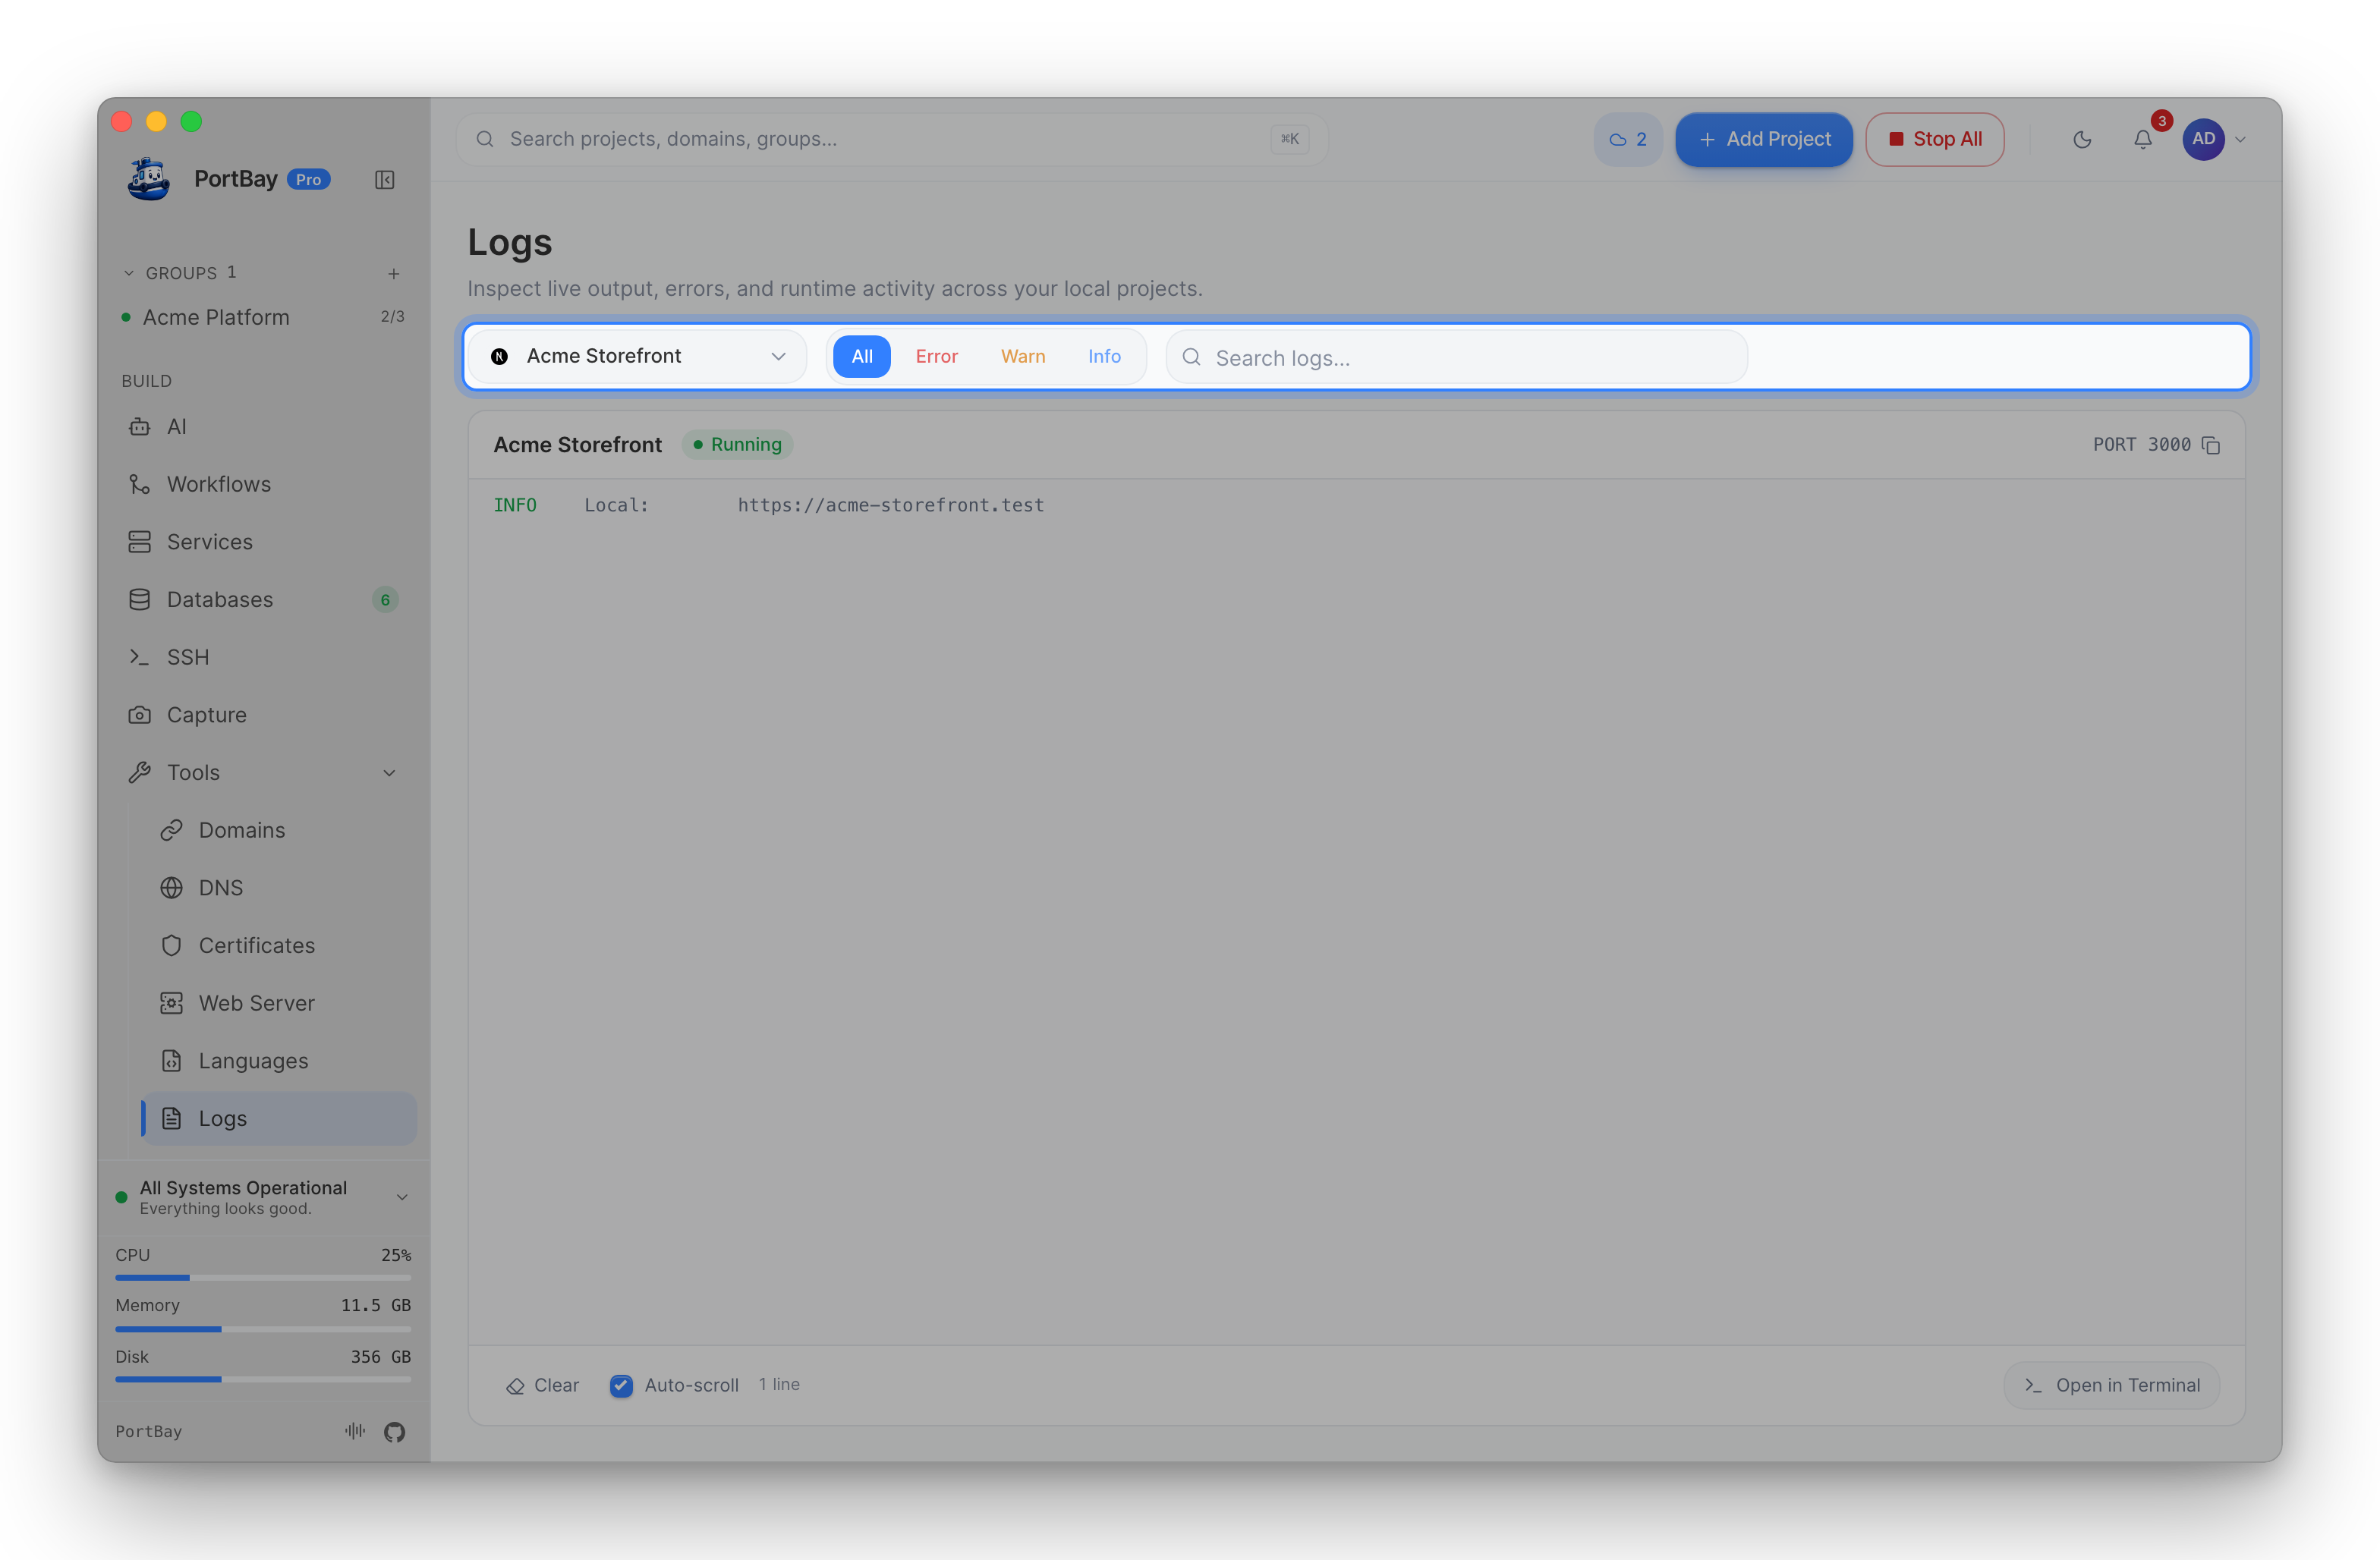
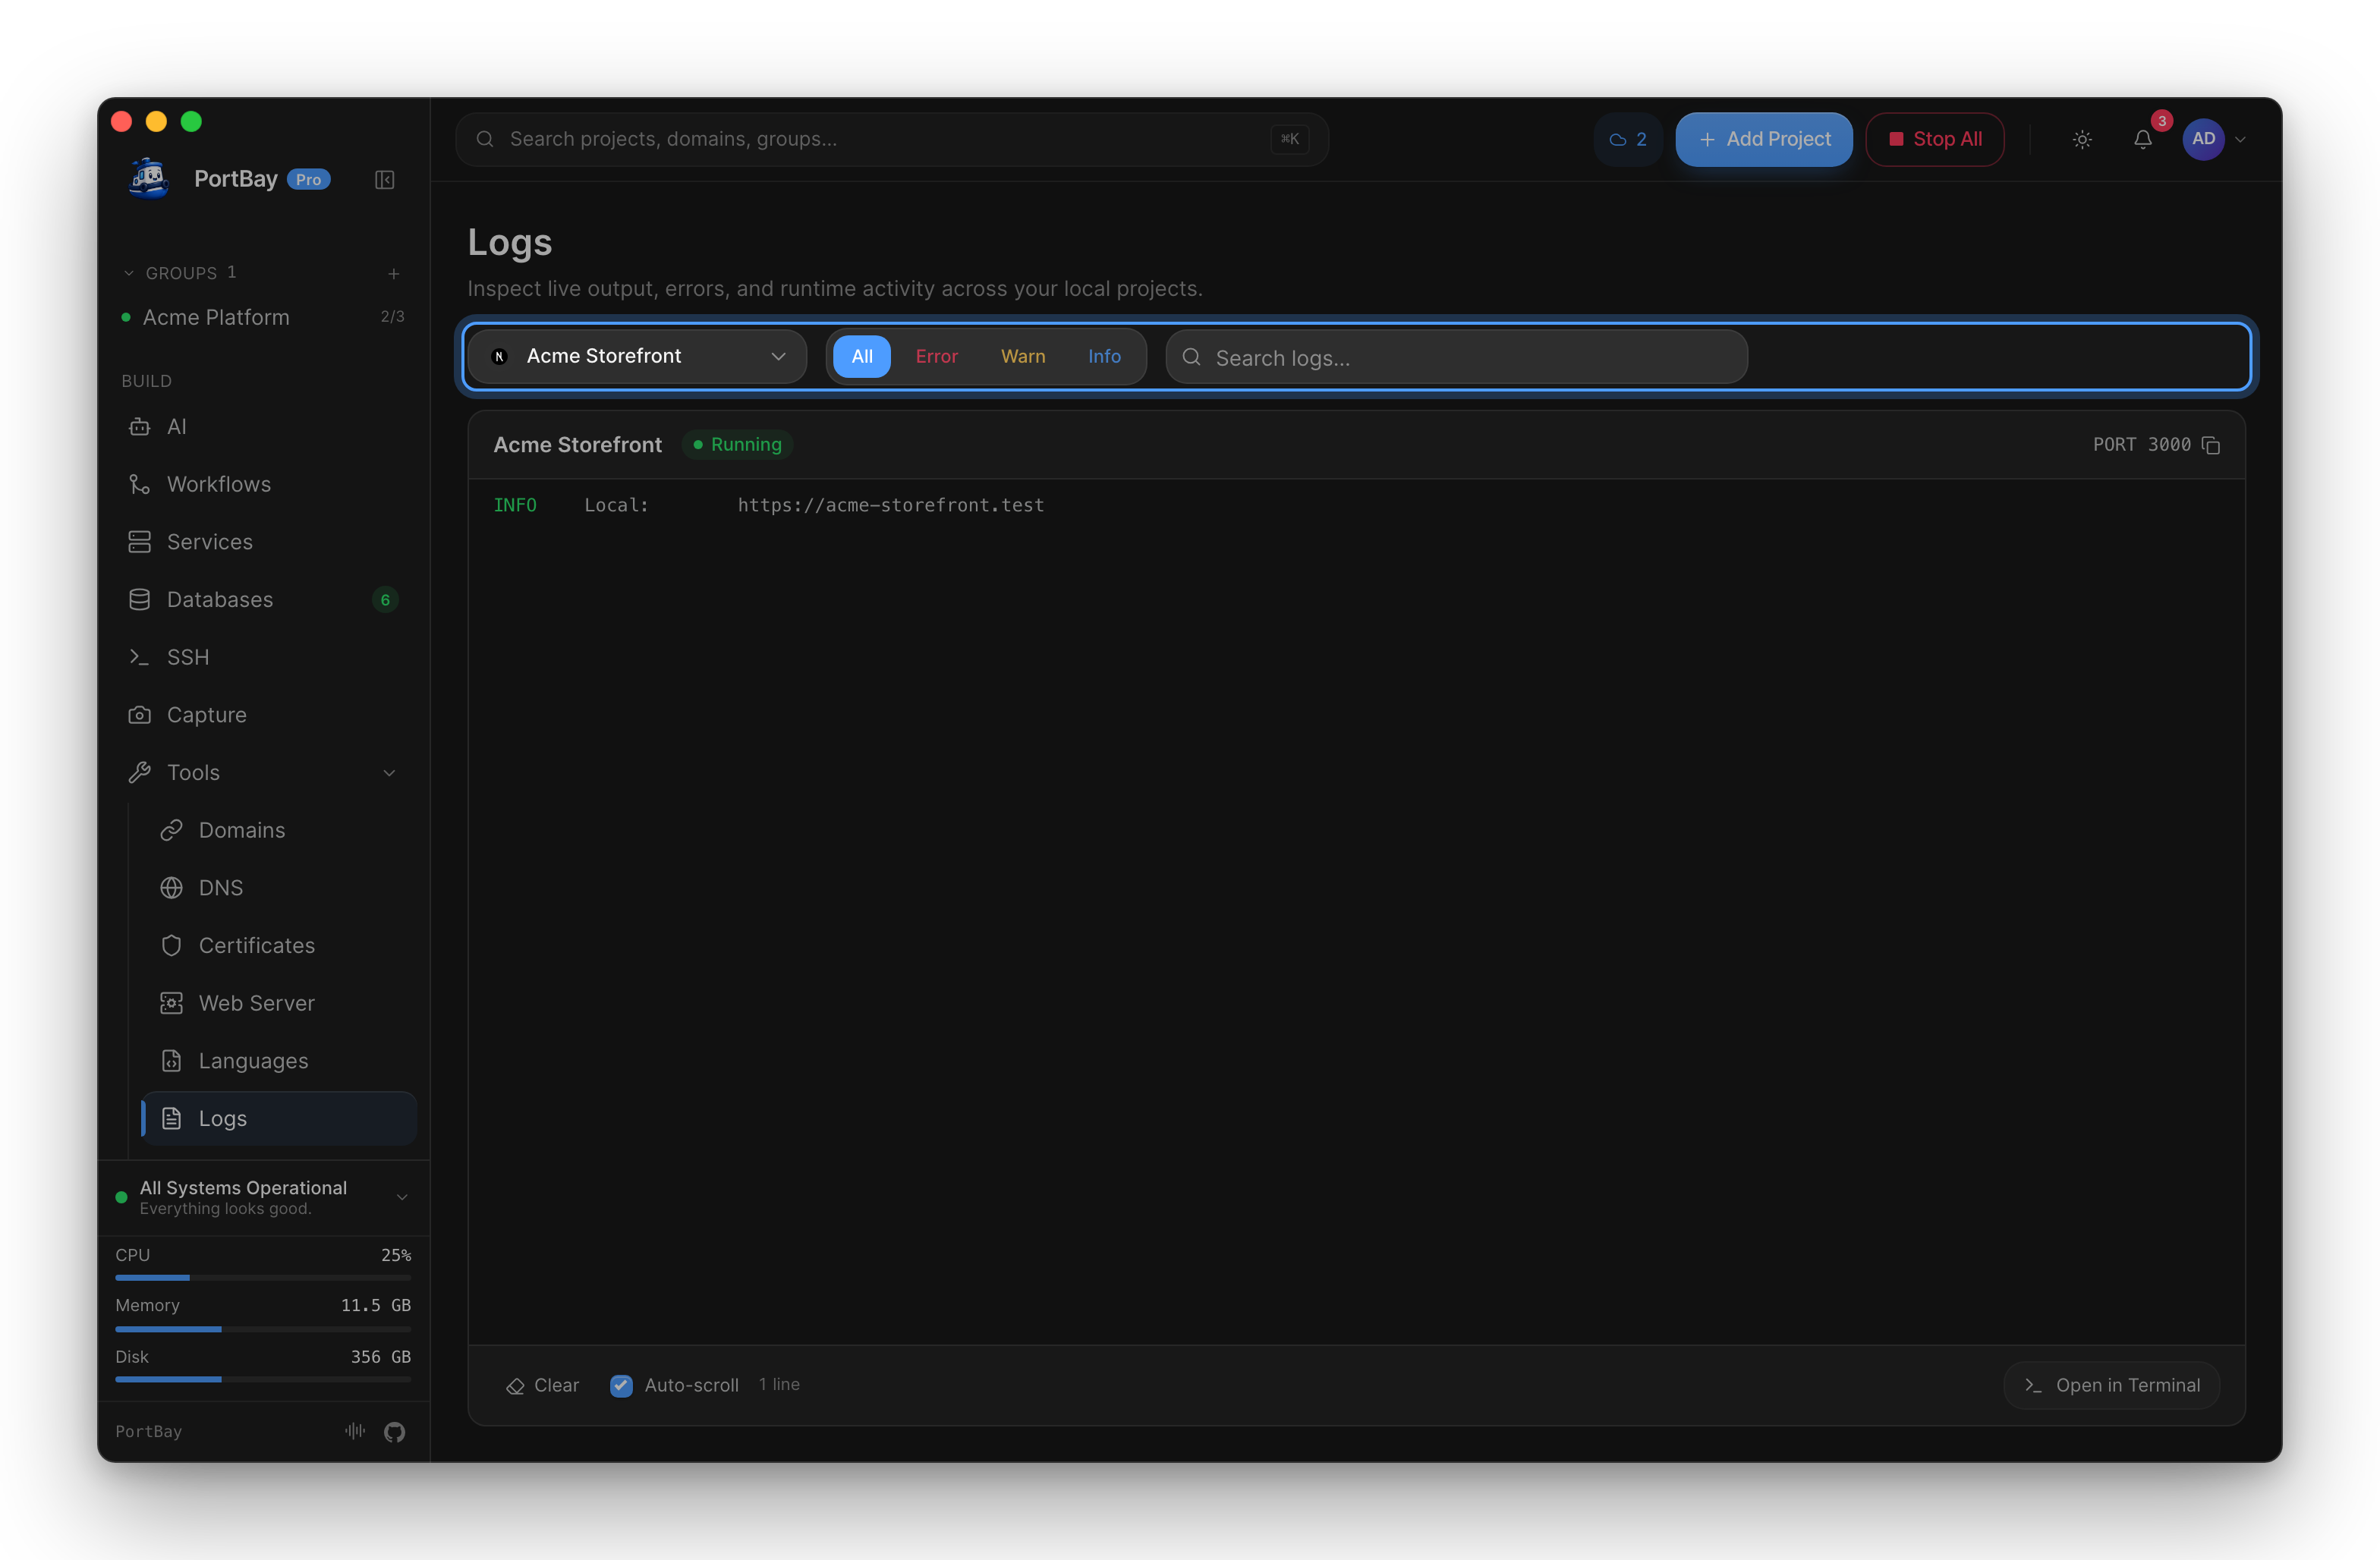
Logs in the sidebar shows the same output as a full page. Pick a project, filter by level (All, Error, Warn, Info) or search, and Auto-scroll keeps the view on the newest line. Scrolling up releases it.
Two Modes
Follow (default)
On open, the viewer fetches the last 1 000 lines via tail_logs, then switches to live streaming. The backend opens a subscribe_logs channel that polls the on-disk log file at 100 ms intervals and forwards each new line. The channel runs in a background thread until Follow is unticked, the viewer is closed, or the app exits — whichever comes first.
When a project restarts, the log file is truncated. Follow mode detects the truncation (file size goes below the last-seen cursor) and re-opens from the beginning, inserting a --- log truncated; re-attached --- marker inline.
If the log file does not exist yet (project newly added, daemon not yet started), Follow waits up to 30 seconds for the file to appear before giving up.
Static Tail
Untick Follow to keep only the snapshot from Process Compose's in-memory buffer. Click the refresh button (↻) in the header to re-fetch.
Log File Location
~/Library/Application Support/PortBay/logs/<project-id>.logThe file is written by Process Compose. Follow mode tails this file directly rather than using PC's WebSocket endpoint, which avoids framing differences across PC minor versions.
What Is Captured
The viewer captures everything the project's start command writes to stdout and stderr. Process Compose wraps each line in a JSON envelope:
{"level":"info","process":"web","replica":0,"message":"> next dev"}The viewer unwraps the message field for display. Lines that do not match the envelope format (plain output from tools that bypass PC's capture) pass through verbatim.
ANSI Colors
ANSI escape sequences are rendered to HTML using the app's theme color tokens. The following severity levels are detected and color-coded:
| Level | Detection |
|---|---|
error | ERROR, FATAL, PANIC tokens; error:, [error], npm err!, command failed patterns |
warn | WARN, WARNING tokens; warn:, [warn], deprecated, unsupported engine patterns |
debug | JSON envelope level field debug or trace |
info | Everything else (default, no extra color) |
Error lines also receive a faint red background. The detection is intentionally specific — phrases like "0 errors" do not trigger the error color.
Search
Press / to focus the search field, or click it directly. Matches are highlighted across all rendered lines. Use n / N to jump to the next or previous match, or the chevron buttons in the header. The x/y counter shows the current position.
Search operates on the stripped plain text (ANSI codes and PC envelope removed), so the query matches what you see.
Buffer Limit
The in-memory buffer is capped at 5 000 lines. When Follow mode pushes the buffer over that limit, the oldest 1 000 lines are dropped to keep DOM size bounded under chatty servers.
Other Controls
| Control | Action |
|---|---|
| Refresh button (↻) | Re-fetch the static 1 000-line snapshot |
| Copy button | Copies all rendered plain-text lines to the clipboard |
Click outside / Escape | Close the viewer |